标签:
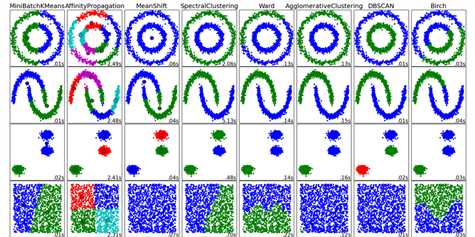
scikit-learn 不同聚类算法的比较
print(__doc__)
import time
import numpy as np
import matplotlib.pyplot as plt
from sklearn import cluster, datasets
from sklearn.neighbors import kneighbors_graph
from sklearn.preprocessing import StandardScaler
np.random.seed(0)
# Generate datasets. We choose the size big enough to see the scalability
# of the algorithms, but not too big to avoid too long running times
n_samples = 1500
noisy_circles = datasets.make_circles(n_samples=n_samples, factor=.5,
noise=.05)
noisy_moons = datasets.make_moons(n_samples=n_samples, noise=.05)
blobs = datasets.make_blobs(n_samples=n_samples, random_state=8)
no_structure = np.random.rand(n_samples, 2), None
colors = np.array([x for x in ‘bgrcmykbgrcmykbgrcmykbgrcmyk‘])
colors = np.hstack([colors] * 20)
clustering_names = [
‘MiniBatchKMeans‘, ‘AffinityPropagation‘, ‘MeanShift‘,
‘SpectralClustering‘, ‘Ward‘, ‘AgglomerativeClustering‘,
‘DBSCAN‘, ‘Birch‘]
plt.figure(figsize=(len(clustering_names) * 2 + 3, 9.5))
plt.subplots_adjust(left=.02, right=.98, bottom=.001, top=.96, wspace=.05,
hspace=.01)
plot_num = 1
datasets = [noisy_circles, noisy_moons, blobs, no_structure]
for i_dataset, dataset in enumerate(datasets):
X, y = dataset
# normalize dataset for easier parameter selection
X = StandardScaler().fit_transform(X)
# estimate bandwidth for mean shift
bandwidth = cluster.estimate_bandwidth(X, quantile=0.3)
# connectivity matrix for structured Ward
connectivity = kneighbors_graph(X, n_neighbors=10, include_self=False)
# make connectivity symmetric
connectivity = 0.5 * (connectivity + connectivity.T)
# create clustering estimators
ms = cluster.MeanShift(bandwidth=bandwidth, bin_seeding=True)
two_means = cluster.MiniBatchKMeans(n_clusters=2)
ward = cluster.AgglomerativeClustering(n_clusters=2, linkage=‘ward‘,
connectivity=connectivity)
spectral = cluster.SpectralClustering(n_clusters=2,
eigen_solver=‘arpack‘,
affinity="nearest_neighbors")
dbscan = cluster.DBSCAN(eps=.2)
affinity_propagation = cluster.AffinityPropagation(damping=.9,
preference=-200)
average_linkage = cluster.AgglomerativeClustering(
linkage="average", affinity="cityblock", n_clusters=2,
connectivity=connectivity)
birch = cluster.Birch(n_clusters=2)
clustering_algorithms = [
two_means, affinity_propagation, ms, spectral, ward, average_linkage,
dbscan, birch]
for name, algorithm in zip(clustering_names, clustering_algorithms):
# predict cluster memberships
t0 = time.time()
algorithm.fit(X)
t1 = time.time()
if hasattr(algorithm, ‘labels_‘):
y_pred = algorithm.labels_.astype(np.int)
else:
y_pred = algorithm.predict(X)
# plot
plt.subplot(4, len(clustering_algorithms), plot_num)
if i_dataset == 0:
plt.title(name, size=18)
plt.scatter(X[:, 0], X[:, 1], color=colors[y_pred].tolist(), s=10)
if hasattr(algorithm, ‘cluster_centers_‘):
centers = algorithm.cluster_centers_
center_colors = colors[:len(centers)]
plt.scatter(centers[:, 0], centers[:, 1], s=100, c=center_colors)
plt.xlim(-2, 2)
plt.ylim(-2, 2)
plt.xticks(())
plt.yticks(())
plt.text(.99, .01, (‘%.2fs‘ % (t1 - t0)).lstrip(‘0‘),
transform=plt.gca().transAxes, size=15,
horizontalalignment=‘right‘)
plot_num += 1
plt.show()
plt.show()
scikit-learn 不同聚类算法的比较
标签:
原文地址:http://www.cnblogs.com/cycloneli/p/4764579.html