标签:des style blog http color os strong io
Demo_Chart_WebGrid
Recently, a demo to design a table and images to display some important data.
In this day, some errors had faced and solved.
Use WebGrid to dispaly the records of table. Use Chart Class to display image.
There are no enough blogs that are complete and accurate,may are outdate or use old tech.
Ok Start Now!
Two Part:
(1) design a table for test, create a view or procedure and input some records for test.
(2) use the view or procedure of the database, design a image by the class of chart and display all the data by the help of WebGrid.
Note: the Part(1) designed is to test and you can use the same method in the database of you computer or server.
In this demo use the view of database,and you can use procedure too.
Part(1) Database
1.Oracle SQL Developer
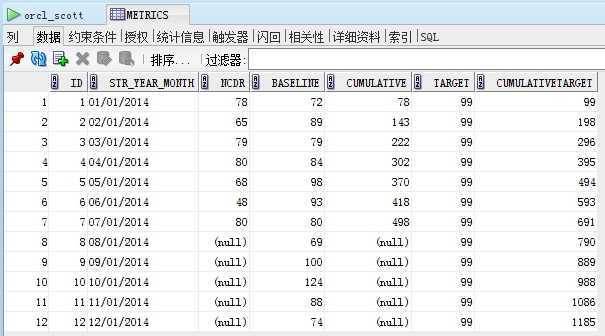
1.1 USE THE URSR SCOTT,CREATE TABLE METRICS and input some data (ID IS PK), you can copy them from the PR_SUM.XLS,you can copy them.
| ID | STR_YEAR_MONTH | NCDR | baseline | cumulative | target | cumulativetarget |
| 1 | 2014/1/1 | 78 | 72 | 78 | 99 | 99 |
| 2 | 2014/2/1 | 65 | 89 | 143 | 99 | 198 |
| 3 | 2014/3/1 | 79 | 79 | 222 | 99 | 296 |
| 4 | 2014/4/1 | 80 | 84 | 302 | 99 | 395 |
| 5 | 2014/5/1 | 68 | 98 | 370 | 99 | 494 |
| 6 | 2014/6/1 | 48 | 93 | 418 | 99 | 593 |
| 7 | 2014/7/1 | 80 | 80 | 498 | 99 | 691 |
| 8 | 2014/8/1 | 69 | 99 | 790 | ||
| 9 | 2014/9/1 | 100 | 99 | 889 | ||
| 10 | 2014/10/1 | 124 | 99 | 988 | ||
| 11 | 2014/11/1 | 88 | 99 | 1086 | ||
| 12 | 2014/12/1 | 74 | 99 | 1185 |
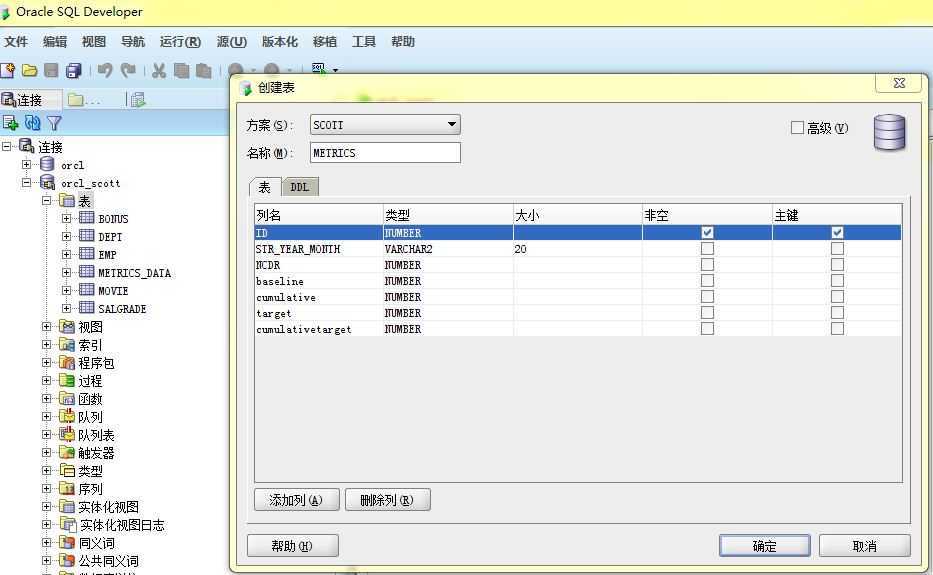
note:PK id, create a PK,avoid some warning from VS on ODAC.
1.2 Open the METRICS input the data and ensure it.(Data use to test)
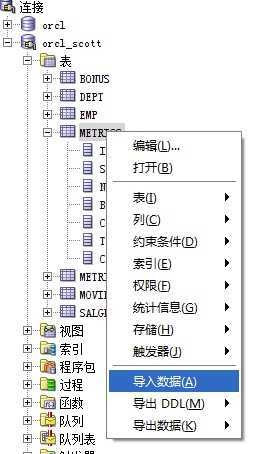
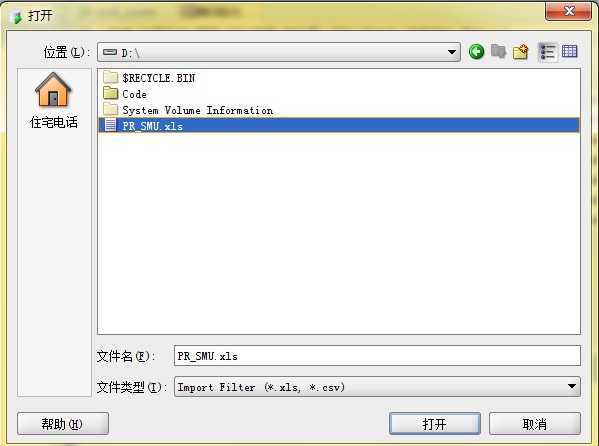
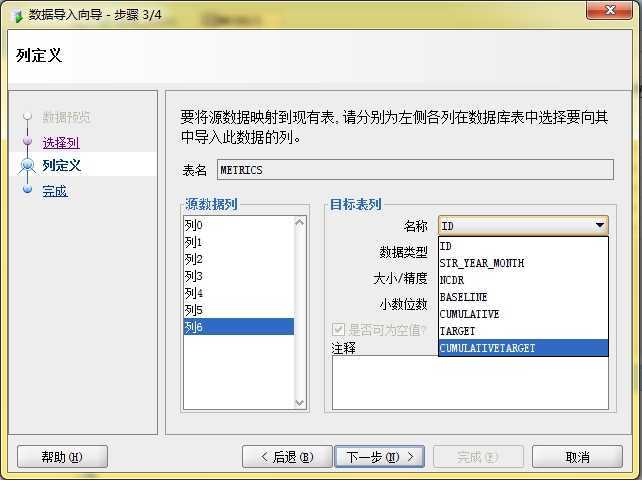
associate the record from XLs and table of database ,there are 7 items
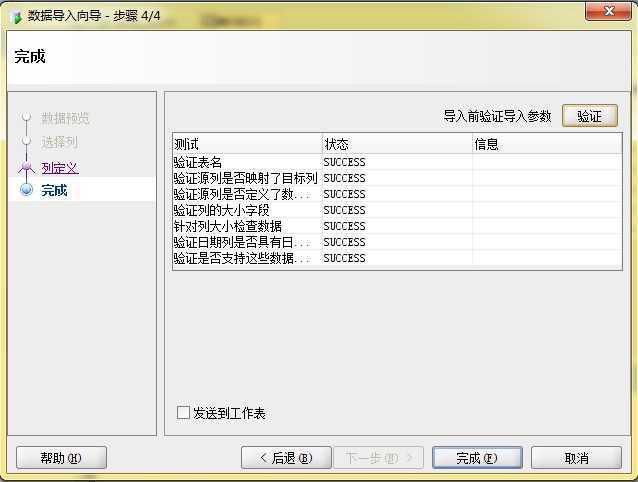
test them, if success,you can do next,because the data that you have input them into table now.
And have a see ensure it.
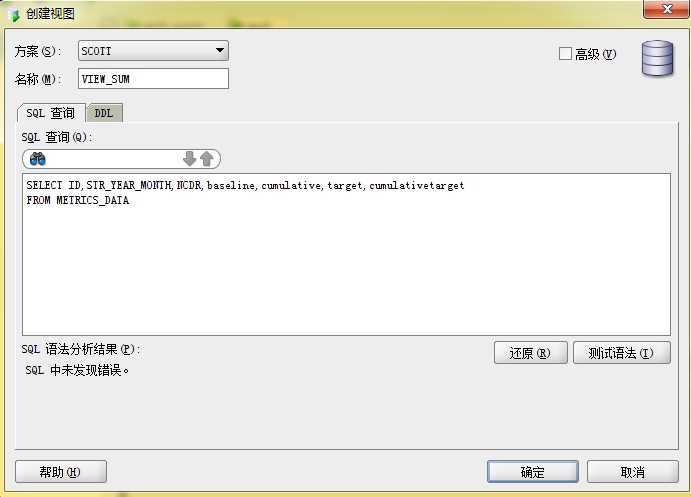
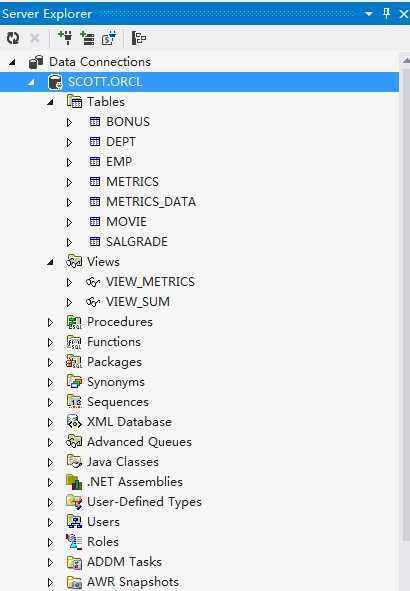
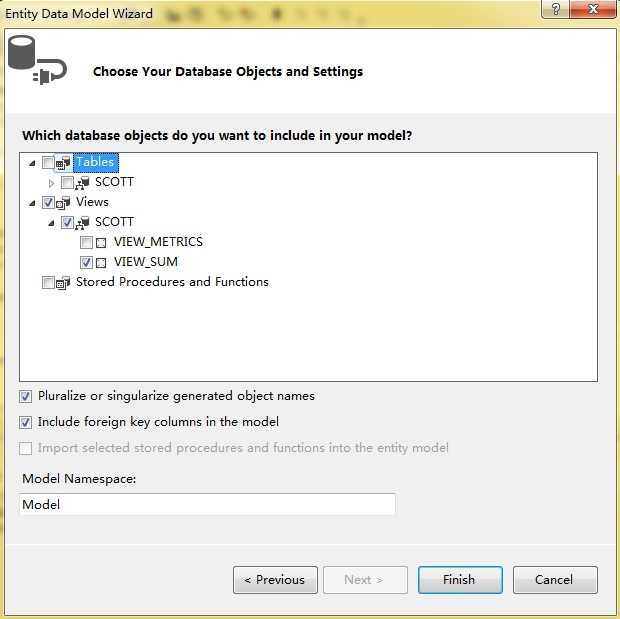
1.3 Use the ROLE OF SYSDBA TO CREATE VIEW and Scheme(方案):SCOTT , VIEW_SUM
advice: use VIEW or PROCEDURE are not table,because use virtual can do more safe Query and much more effects.
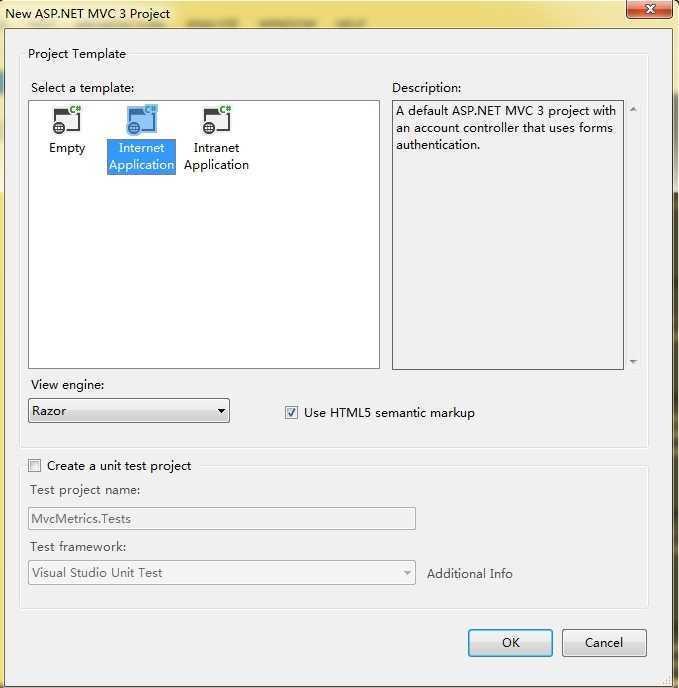
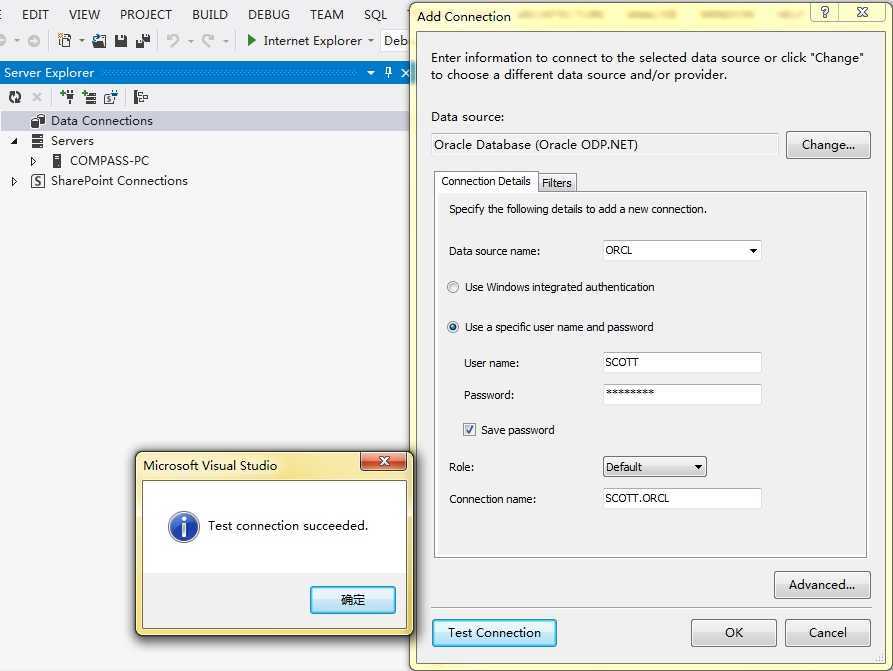
2.MVC+ORACLE+ODAC(use the view of database )
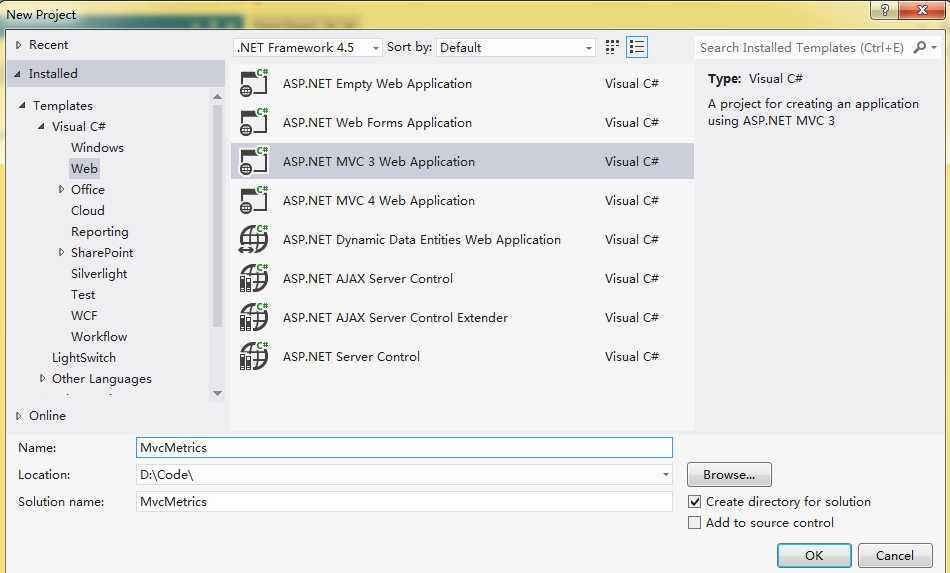
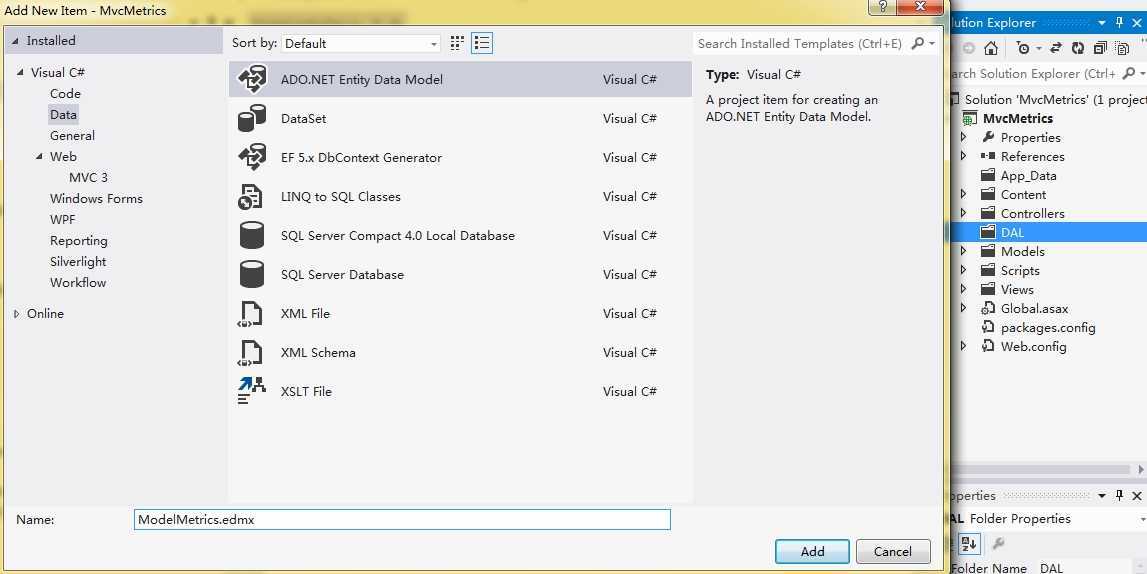
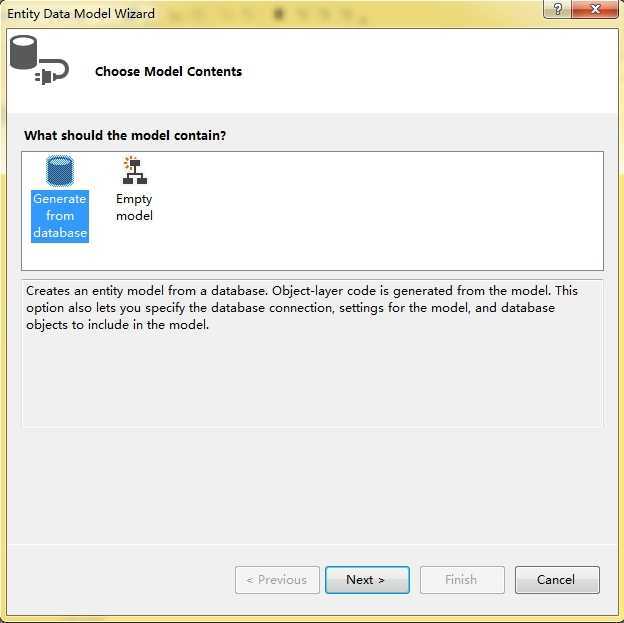
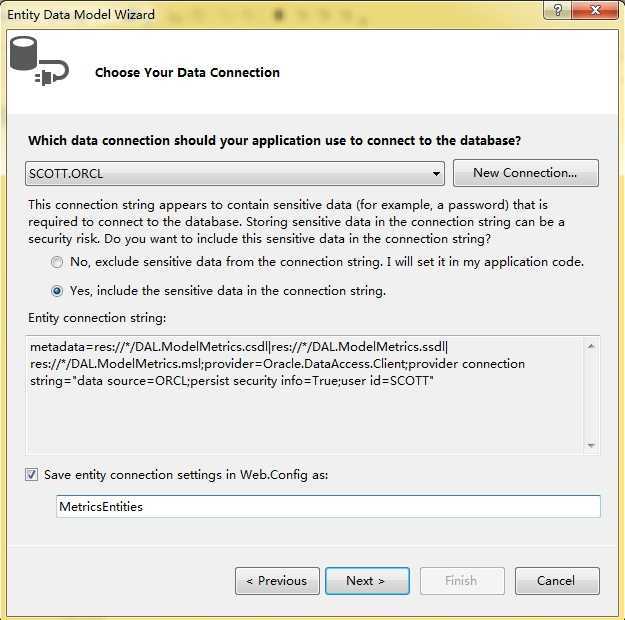
note:Now,you can create a database Context to do much things,it‘s easy.
use the database context to display the all records by the view of databse.
in the HomeController.cs In the HomeController, the Action Index

 1 using MvcMetrics.DAL;
 2
 3 using System.Web.Helpers;
 4
 5
 6
 7 //database Context
 8
 9 private MetricsEntities db = new MetricsEntities();
10
11
12
13
14
15
16
17         public ActionResult Index()
18
19         {
20
21             //ViewBag.Message = "Welcome to ASP.NET MVC!";
22
23             //use VIEW from database
24
25             var records = db.VIEW_SUM.ToList();
26
27
28
29             var grid = new WebGrid(
30
31                                 source: records,
32
33                                 fieldNamePrefix: "grid_",
34
35                                 defaultSort: "RELEASEDATE",// the way of sort
36
37                                 canPage: true,
38
39                                 canSort: true,
40
41                                 ajaxUpdateContainerId: "DivGrid", // ajaxUpadate bind
42
43                                 pageFieldName: "paging",
44
45                                 sortDirectionFieldName: "RELEASEDATE",
46
47                                  rowsPerPage: 4 //per page the count of records
48
49                                   );
50
51             return View(grid);
52
53
54
55         }
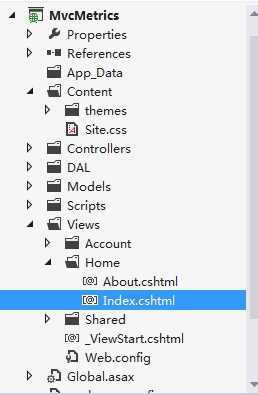
In the view of Index,you can see that
@{

    ViewBag.Title = "Home Page";

}


<h2>@ViewBag.Message</h2>

<p>

    To learn more about ASP.NET MVC visit <a href="http://asp.net/mvc" title="ASP.NET MVC Website">http://asp.net/mvc</a>.

</p>
Change it.
 1 @model WebGrid
 2
 3
 4
 5 @{
 6
 7     ViewBag.Title = "Test";
 8
 9 }
10
11
12
13 <div id="DivGrid">
14
15 @Model.GetHtml(
16
17         columns: @Model.Columns(
18
19                      @Model.Column("ID", "NO"),
20
21                      @Model.Column("STR_YEAR_MONTH", format: @<i>@item.STR_YEAR_MONTH</i>, canSort: false),
22
23                      @Model.Column("NCDR", "NCDR", format: @<b><i>@item.NCDR</i></b>, canSort: false),
24
25                      @Model.Column("baseline", format: @<i>@item.baseline</i>, canSort: false),
26
27                      @Model.Column("cumulative",format: @<i>@item.cumulative</i>, canSort: false),
28
29                      @Model.Column("target", format: @<i>@item.target</i>, canSort: false),
30
31                      @Model.Column("cumulativetarget", format: @<i>@item.cumulativetarget</i>, canSort: false)),
32
33        tableStyle: "grid", headerStyle: "headerStyle1",
34
35        selectedRowStyle: "selectedRowStyle",
36
37        caption: "List METRICS_DATA Table",
38
39        displayHeader: !IsPost,
40
41        fillEmptyRows: !IsPost,
42
43        emptyRowCellValue: "",
44
45        mode: WebGridPagerModes.All,
46
47        firstText: "First",
48
49        previousText: "Previous", nextText: "Next",
50
51        lastText: "Last"
52
53
54
55 )
56
57 </div>
58
59 <h3>
60
61     Page Count:
62
63     @Html.Encode(@Model.PageCount)
64
65     <br/>
66
67     Total Record:
68
69     @Html.Encode(@Model.TotalRowCount)
70
71 </h3>
Note: @model WebGrid, Declare variables the you will use.
now,you can run it,and see the record from table(Metric)
In Controller, you can create a WebGird,and set items,and others, return the WebGrid to View(MVC).
In View of MVC, you can get WebGrid and display the records.
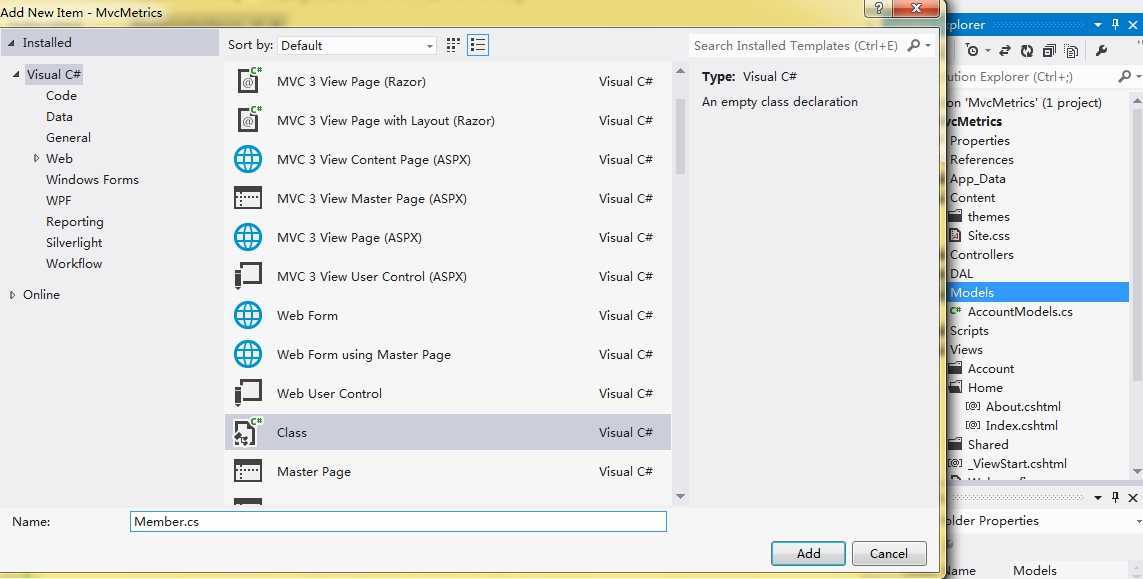
In the Models ,add a class of member
1         public string Date { get; set; }
2
3         public double Value { get; set; }
In the HomeController, add this Action
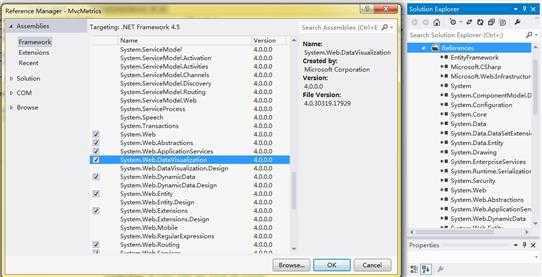
Firstly, add reference System.Web.DataVisualization.
using MvcMetrics.Models;

using System.Web.UI.DataVisualization.Charting;

using System.IO;


        public FileResult GetChart()

        {

            //NCDR,baseline,cumulative,target,cumulativetarge

            //We use target make the  scale of X and Y

            //use VIEW of database,get the all records

            var records = db.VIEW_SUM.ToList();


            List<double> dataNCDR = new List<double>();//NCDR

            List<double> databaseline = new List<double>();//baseline

            List<double> datacumulative = new List<double>();//cumulative

            List<Member> datatarget = new List<Member>();//target, X and Y

            List<double> datacumulativetarget = new List<double>();//cumulativetarget


            //spefical null,get the data for NCD,baseline,cumulative,target,cumulativetarge

            foreach (var record in records)

            {

                //note : the start is not null,so can deal with it in this way

                if (record.NCDR != null)

                    dataNCDR.Add((double)record.NCDR);


                databaseline.Add((double)record.BASELINE);


                if (record.CUMULATIVE != null)

                    datacumulative.Add((double)record.CUMULATIVE);


                //Member.Data is the X scale, Member.Value is the Y scale,the important is X scale

                Member temp = new Member() { Date = record.STR_YEAR_MONTH, Value = (double)record.TARGET };

                datatarget.Add(temp);

                datacumulativetarget.Add((double)record.CUMULATIVETARGET);

            }


            System.Web.UI.DataVisualization.Charting.Chart Chart1 = new System.Web.UI.DataVisualization.Charting.Chart();


            //the Height and Width of Chart1

            Chart1.Width = 800;//412

            Chart1.Height = 480;//296


            Chart1.RenderType = System.Web.UI.DataVisualization.Charting.RenderType.ImageTag;

            Chart1.Palette = ChartColorPalette.BrightPastel;

            Title t = new Title("NCDR Test MVC", Docking.Top, new System.Drawing.Font("Trebuchet MS", 14, System.Drawing.FontStyle.Bold),System.Drawing.Color.FromArgb(26, 59, 105));

            Chart1.Titles.Add(t);//add Title of Chart1


            //create a area of Chart1,use "Series 1" or others.

            Chart1.ChartAreas.Add("Series 1");


            //set Coordinate axis intervals Of X = 1

            Chart1.ChartAreas[0].AxisX.Interval = 1;

            Chart1.ChartAreas[0].AxisX.IntervalOffset = 1;

            //the scale of X display in one line or two line when it >= 9

            Chart1.ChartAreas[0].AxisX.LabelStyle.IsStaggered = false;

            //change the x display Angle

            Chart1.ChartAreas[0].AxisX.LabelStyle.Angle = 45;


            //add Series, five .   the "Series 6" is used to make other effect

            Chart1.Series.Add("Series 1");

            Chart1.Series.Add("Series 2");

            Chart1.Series.Add("Series 3");

            Chart1.Series.Add("Series 4");

            Chart1.Series.Add("Series 5");

            Chart1.Series.Add("Series 6");//make other effect


            //test,in one Chart, Column 1 and Line 4

            Chart1.Series["Series 1"].ChartType = SeriesChartType.Column;//StackedColumn  Column

            Chart1.Series["Series 2"].ChartType = SeriesChartType.Line;

            Chart1.Series["Series 3"].ChartType = SeriesChartType.Line;

            Chart1.Series["Series 4"].ChartType = SeriesChartType.Line;

            Chart1.Series["Series 5"].ChartType = SeriesChartType.Line;


            ////make other effect

            Chart1.Series["Series 6"].ChartType = SeriesChartType.Point;

            // display the value of the Point

            Chart1.Series["Series 3"].IsValueShownAsLabel = true;

            Chart1.Series["Series 5"].IsValueShownAsLabel = true;


            //DataBindXY()  ,X scale,Y scale,use datatarget,"Series 4"

            Chart1.Series["Series 4"].Points.DataBindXY(datatarget, "date", datatarget, "value");


            //make Chart

            foreach (double value in dataNCDR)

            {

                Chart1.Series["Series 1"].Points.AddY(value);

            }


            foreach (double value in databaseline)

            {

                Chart1.Series["Series 2"].Points.AddY(value);

            }


            foreach (double value in datacumulative)

            {

                //double effects use the "Series 3" and "Series 6"

                Chart1.Series["Series 3"].Points.AddY(value);

                Chart1.Series["Series 6"].Points.AddY(value);

            }


            foreach (double value in datacumulativetarget)

            {

                Chart1.Series["Series 5"].Points.AddY(value);

            }


            //NCDR,baseline,cumulative,target,cumulativetarge

            Chart1.Series["Series 1"].Name = "NCDR";

            Chart1.Series["Series 2"].Name = "baseline";

            Chart1.Series["Series 3"].Name = "cumulative";

            Chart1.Series["Series 4"].Name = "target";

            Chart1.Series["Series 5"].Name = "cumulativetarge";


            //the "Series 6" do not displey in the Legend

            Chart1.Series["Series 6"].IsVisibleInLegend = false;


            //X Title

            Chart1.ChartAreas[0].AxisX.Title = "Date";

            Chart1.ChartAreas[0].AxisX.TitleFont = new System.Drawing.Font("Anonymous Pro", 10, System.Drawing.FontStyle.Regular);


            //Y Title

            Chart1.ChartAreas[0].AxisY.Title = "Value";

            Chart1.ChartAreas[0].AxisY.TitleFont = new System.Drawing.Font("Anonymous Pro", 10, System.Drawing.FontStyle.Regular);


            //x Major Line

            Chart1.ChartAreas[0].AxisX.MajorGrid.Enabled = false;

            Chart1.ChartAreas[0].BorderDashStyle = ChartDashStyle.Solid;   //设置chartareas区域的边框样式


            //Border    the style of Border

            Chart1.BorderSkin.SkinStyle = BorderSkinStyle.Emboss;

            Chart1.BorderlineWidth = 2;

            Chart1.BorderColor = System.Drawing.Color.Black;

            Chart1.BorderlineDashStyle = ChartDashStyle.Solid;

            Chart1.BorderWidth = 2;


            //the location of Legend

            Legend legend1 = new Legend();

            legend1.Docking = Docking.Top;

            legend1.Alignment = System.Drawing.StringAlignment.Center;


            Chart1.Legends.Add(legend1);


            //IO

            MemoryStream imageStream = new MemoryStream();

            Chart1.SaveImage(imageStream, ChartImageFormat.Png);

            imageStream.Position = 0;

            return new FileStreamResult(imageStream, "image/png");


        }
in index.cshtml,add
<div>

    <img src="/Home/GetChart" alt="Chart" />

</div>
the Chart you can read it from code,enough comments can display the effect of all.
Chart, ChartArea,Series ,Legend, that you can set and make nice images.
At last, the IO (MemoryStream and FileStream ,ImageStream ) that are usually used to display image.
Run,Result:
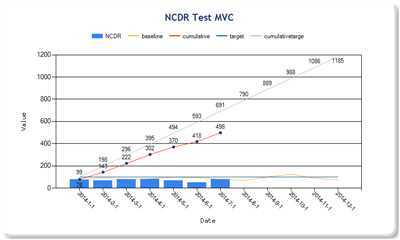
MVC3_Chart_WebGrid,布布扣,bubuko.com
标签:des style blog http color os strong io
原文地址:http://www.cnblogs.com/chinazhoumin/p/3875622.html
