标签:title bsp 标准 随机 画图 sub 技术分享 color highlight
利用matplotlib 画图模块,汇至子图
# -*- coding: utf-8 -*-
#子图 subplot() 行、列,当前所在区域
import matplotlib.pylab as mtp
import numpy.random as nprd
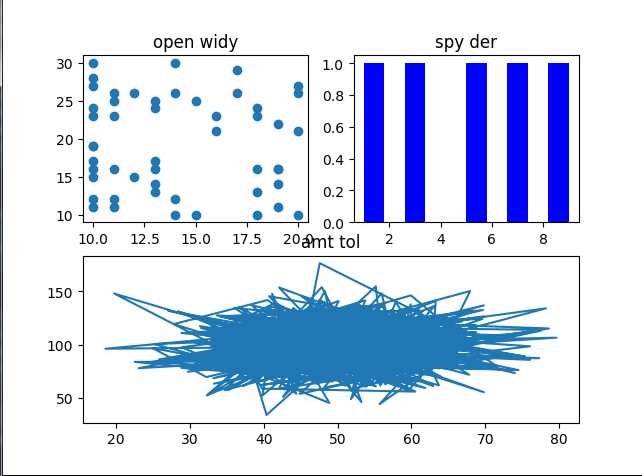
#汇3个图,上面2个,下面一个
#左上角图
mtp.subplot(2,2,1)
x1=nprd.random_integers(10,20,50) #生成随机值(最小值、最大值,个数)
y1=nprd.random_integers(10,30,50)
mtp.plot(x1,y1,‘o‘)
mtp.title("open widy") #设置图名
#右上角图
mtp.subplot(2,2,2)
x2=[1,3,5,7,9]
mtp.hist(x2,color=‘b‘)
mtp.title("spy der")
#下部图
mtp.subplot(2,1,2)
x3=nprd.normal(50,10,1000) #生成正态分布随机值(均值、标准差,个数)
y3=nprd.normal(100,20,1000)
mtp.plot(x3,y3,‘-‘)
mtp.title("amt tol")
mtp.show()
结果如图:
标签:title bsp 标准 随机 画图 sub 技术分享 color highlight
原文地址:http://www.cnblogs.com/kimbo/p/6534931.html