标签:arch let lap receive alt baidu lan ssi change
web服务器压测工具也挺多,这里只介绍我用过的这两种--siege(for linux)、ab(for windows)。
1、简介:
Siege是一款开源的压力测试工具,设计用于评估WEB应用在压力下的承受能力。可以根据配置对一个WEB站点进行多用户的并发访问,记录每个用户所有请求过程的相应时间,并在一定数量的并发访问下重复进行。siege可以从您选择的预置列表中请求随机的URL。所以siege可用于仿真用户请求负载,而ab则不能。但不要使用siege来执行最高性能基准调校测试,这方面ab就准确很多。
2、安装:
官方:http://www.joedog.org/
Siege下载:http://www.joedog.org/pub/siege/siege-latest.tar.gz
解压:
# tar -zxf siege-latest.tar.gz
进入解压目录:
# cd siege-latest.tar.gz/
安装:
#./configure ; make
#make install
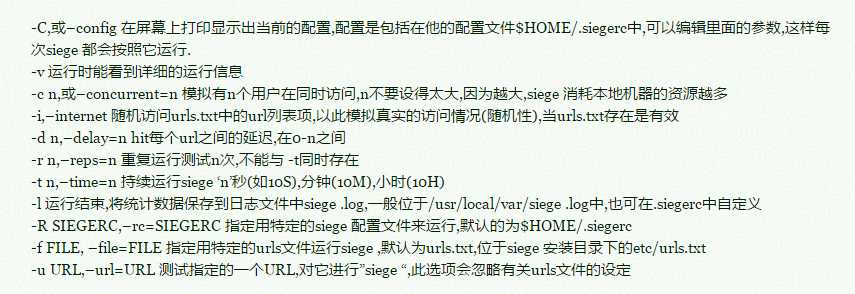
3、参数详解:
4、使用:
siege -c 100 -r 10 "https://www.baidu.com/"
-c 100表示并发模拟100个用户并发,-r 10表示重复运行10次
** SIEGE 3.0.8
** Preparing 100 concurrent users for battle.
The server is now under siege.. done.Transactions: 909 hits #完成909次处理
Availability: 90.90 % #成功率
Elapsed time: 71.83 secs #总共耗时
Data transferred: 0.15 MB #总共传输数据量
Response time: 1.66 secs #响应时间
Transaction rate: 12.65 trans/sec #平均每秒处理数
Throughput: 0.00 MB/sec #平均每秒传输数据量
Concurrency: 20.98 #实际最大并发数
Successful transactions: 909 #成功处理数
Failed transactions: 91 #失败处理数
Longest transaction: 63.17 #单次最长耗时
Shortest transaction: 0.02 #单次最短耗时
FILE: /var/log/siege.log
You can disable this annoying message by editing
the .siegerc file in your home directory; change
the directive ‘show-logfile‘ to false.
1、简介
ab的全称是ApacheBench,是 Apache 附带的一个小工具,专门用于 HTTP Server 的benchmark testing,可以同时模拟多个并发请求
2、下载
http://apache.mirrors.pair.com/httpd/
或安装Apache自带
3、使用:
向 www.google.com 发送10个请求(-n 10) ,并每次发送10个请求(-c 10)——也就是说一次都发过去了。
C:\Users\admin>ab -n 10 -c 10 http://www.google.com/
This is ApacheBench, Version 2.3 <$Revision: 1748469 $>
Copyright 1996 Adam Twiss, Zeus Technology Ltd, http://www.zeustech.net/
Licensed to The Apache Software Foundation, http://www.apache.org/
Benchmarking www.google.com (be patient).....done
Server Software: gws
Server Hostname: www.google.com
Server Port: 80
Document Path: /
Document Length: 390 bytes
Concurrency Level: 10
Time taken for tests: 0.274 seconds
Complete requests: 10
Failed requests: 0
Non-2xx responses: 10
Total transferred: 11330 bytes
HTML transferred: 3900 bytes
Requests per second: 36.47 [#/sec] (mean)
Time per request: 274.207 [ms] (mean)
Time per request: 27.421 [ms] (mean, across all concurrent requests)
Transfer rate: 40.35 [Kbytes/sec] received
Connection Times (ms)
min mean[+/-sd] median max
Connect: 24 24 0.4 24 25
Processing: 31 113 67.4 121 218
Waiting: 31 113 67.4 121 218
Total: 55 138 67.5 145 243
Percentage of the requests served within a certain time (ms)
50% 145
66% 170
75% 194
80% 218
90% 243
95% 243
98% 243
99% 243
100% 243 (longest request)
/*整个测试持续的时间*/
Time taken for tests: 3.234651 seconds
/*完成的请求数量*/
Complete requests: 10
/*失败的请求数量*/
Failed requests: 0
Write errors: 0
Non-2xx responses: 10
Keep-Alive requests: 10
/*整个场景中的网络传输量*/
Total transferred: 6020 bytes
/*整个场景中的HTML内容传输量*/
HTML transferred: 2300 bytes
/*大家最关心的指标之一,相当于 LR 中的 每秒事务数 ,后面括号中的 mean 表示这是一个平均值*/
Requests per second: 3.09 [#/sec] (mean)
/*大家最关心的指标之二,相当于 LR 中的 平均事务响应时间 ,后面括号中的 mean 表示这是一个平均值*/这个是用户平均请求等待时间。
Time per request: 3234.651 [ms] (mean)
/*这个是服务器平均请求处理时间*/
Time per request: 323.465 [ms] (mean, across all concurrent requests)
/*平均每秒网络上的流量,可以帮助排除是否存在网络流量过大导致响应时间延长的问题*/
Transfer rate: 1.55 [Kbytes/sec] received
/*网络上消耗的时间的分解,各项数据的具体算法还不是很清楚*/
Connection Times (ms)
min mean[+/-sd] median max
Connect: 20 318 926.1 30 2954
Processing: 40 2160 1462.0 3034 3154
Waiting: 40 2160 1462.0 3034 3154
Total: 60 2479 1276.4 3064 3184
/*下面的内容为整个场景中所有请求的响应情况。在场景中每个请求都有一个响应时间,其中 50% 的用户响应时间小于 3064 毫秒,60 % 的用户响应时间小于 3094 毫秒,最大的响应时间小于 3184 毫秒*/
Percentage of the requests served within a certain time (ms)
50% 3064
66% 3094
75% 3124
80% 3154
90% 3184
95% 3184
98% 3184
99% 3184
100% 3184 (longest request)
由于对于并发请求,cpu实际上并不是同时处理的,而是按照每个请求获得的时间片逐个轮转处理的,所以基本上第一个Time per request时间约等于第二个Time per request时间乘以并发请求数
参考:
1、http://www.cnblogs.com/yangxia-test/archive/2012/12/06/2804801.html
标签:arch let lap receive alt baidu lan ssi change
原文地址:http://www.cnblogs.com/GO-NO-1/p/6727804.html