标签:支持 基本用法 数据表 gray label src 文件 添加 文档
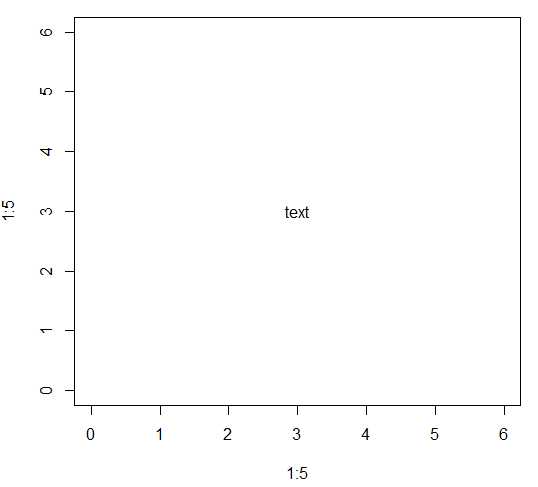
text函数用来在一张图表上添加文字,只需要指定对应的x和y坐标,以及需要添加的文字内容就可以了
基本用法:
plot(1:5, 1:5, xlim = c(0,6), ylim = c (0,6), type = "n")
text(x = 3, y = 3, labels = "text")
效果图如下:
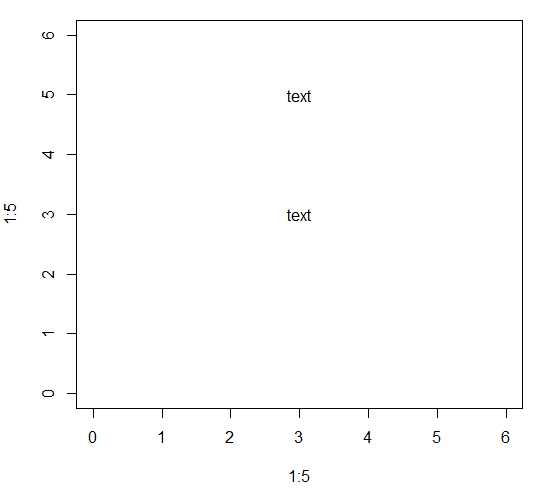
支持同时创建多个text标签
代码示例:
plot(1:5, 1:5, xlim = c(0,6), ylim = c (0,6), type = "n")
text(x = c(3, 3), y = c(3, 5), labels = c("text", "text"))
效果图如下:
参数调整:
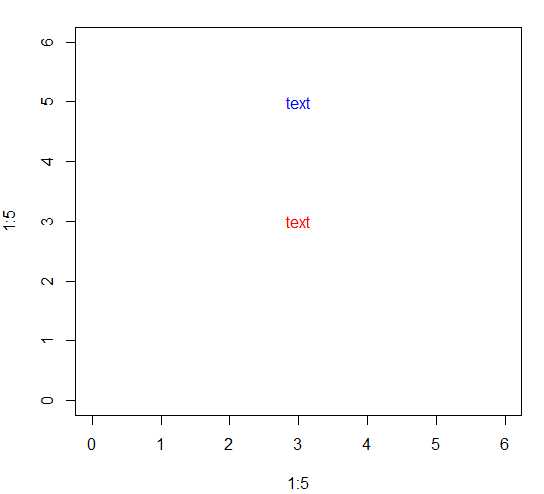
col : 设置文字的颜色
代码示例:
plot(1:5, 1:5, xlim = c(0,6), ylim = c (0,6), type = "n")
text(x = c(3, 3), y = c(3, 5), labels = c("text", "text"), col = c("red", "blue"))
效果图如下:
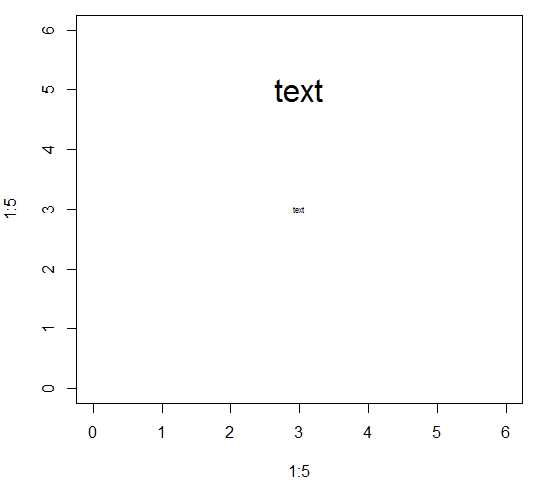
cex : 设置文字的大小
代码示例:
plot(1:5, 1:5, xlim = c(0,6), ylim = c (0,6), type = "n")
text(x = c(3, 3), y = c(3, 5), labels = c("text", "text"), cex = c( 0.5 , 2 ))
效果图如下:
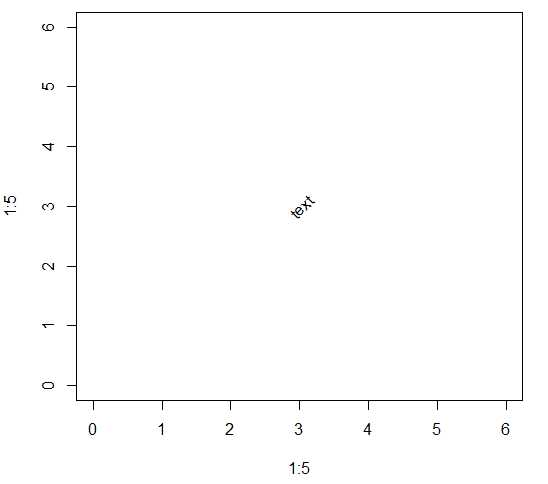
sort : 对文件进行旋转
代码示例:
plot(1:5, 1:5, xlim = c(0,6), ylim = c (0,6), type = "n")
text(x = 3, y = 3, labels = "text", srt = 45)
效果图如下:
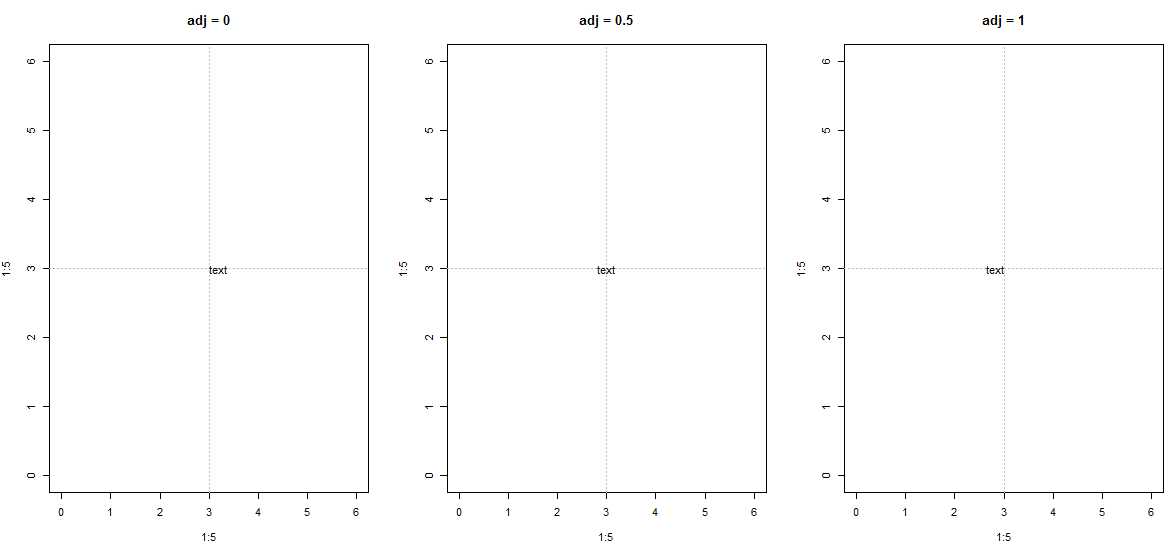
adj : 调整文字的位置,一个值时调整的是x轴的位置,如果为两个值时,第一个调整的是x轴的位置,第二个调整的是y轴的位置,可选范围为[0, 1]
对x轴进行调整,代码示例:
par(mfrow = c(1,3))
plot(1:5, 1:5, xlim = c(0,6), ylim = c (0,6), type = "n", main = "adj = 0")
abline(h = 3, v = 3 , col = "gray", lty = 3)
text(x = 3, y = 3, labels = "text", adj = 0)
plot(1:5, 1:5, xlim = c(0,6), ylim = c (0,6), type = "n", main = "adj = 0.5")
abline(h = 3, v = 3 , col = "gray", lty = 3)
text(x = 3, y = 3, labels = "text", adj = 0.5)
plot(1:5, 1:5, xlim = c(0,6), ylim = c (0,6), type = "n", main = "adj = 1")
abline(h = 3, v = 3 , col = "gray", lty = 3)
text(x = 3, y = 3, labels = "text", adj = 1)
x轴调整的效果图如下:
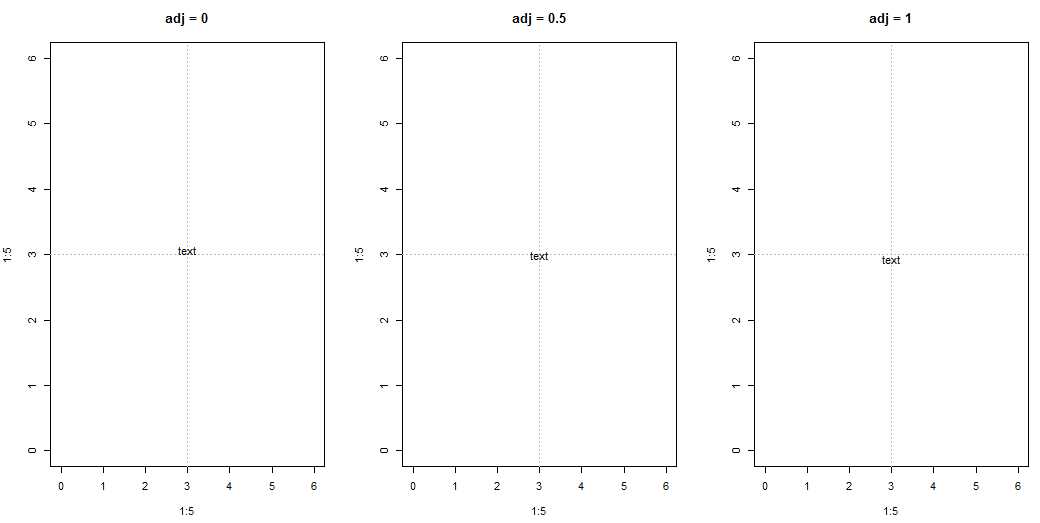
对y轴进行调整,代码示例:
par(mfrow = c(1,3))
plot(1:5, 1:5, xlim = c(0,6), ylim = c (0,6), type = "n", main = "adj = 0")
abline(h = 3, v = 3 , col = "gray", lty = 3)
text(x = 3, y = 3, labels = "text", adj = c(0.5, 0))
plot(1:5, 1:5, xlim = c(0,6), ylim = c (0,6), type = "n", main = "adj = 0.5")
abline(h = 3, v = 3 , col = "gray", lty = 3)
text(x = 3, y = 3, labels = "text", adj = c(0.5, 0.5))
plot(1:5, 1:5, xlim = c(0,6), ylim = c (0,6), type = "n", main = "adj = 1")
abline(h = 3, v = 3 , col = "gray", lty = 3)
text(x = 3, y = 3, labels = "text", adj = c(0.5, 1))
y轴调整的效果图如下:
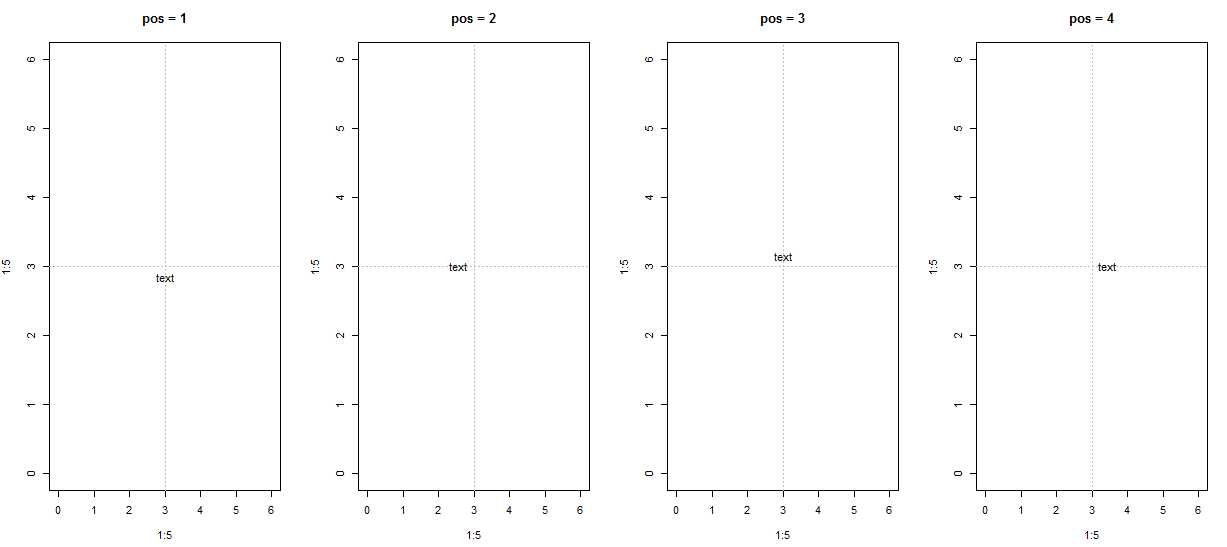
pos: 也是对文字的位置进行调整,不能和adj参数同时使用, 可选值为1, 2, 3, 4, 分别对应下, 上, 左, 右4个方向
代码示例:
par(mfrow = c(1, 4))
plot(1:5, 1:5, xlim = c(0,6), ylim = c (0,6), type = "n", main = "pos = 1")
abline(h = 3, v = 3 , col = "gray", lty = 3)
text(x = 3, y = 3, labels = "text", pos = 1)
plot(1:5, 1:5, xlim = c(0,6), ylim = c (0,6), type = "n", main = "pos = 2")
abline(h = 3, v = 3 , col = "gray", lty = 3)
text(x = 3, y = 3, labels = "text", pos = 2)
plot(1:5, 1:5, xlim = c(0,6), ylim = c (0,6), type = "n", main = "pos = 3")
abline(h = 3, v = 3 , col = "gray", lty = 3)
text(x = 3, y = 3, labels = "text", pos = 3)
plot(1:5, 1:5, xlim = c(0,6), ylim = c (0,6), type = "n", main = "adj = 4")
abline(h = 3, v = 3 , col = "gray", lty = 3)
text(x = 3, y = 3, labels = "text", pos = 4)
效果图如下:
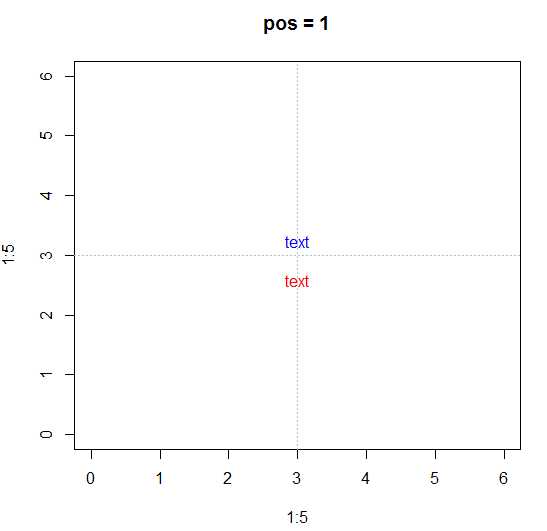
offset : 只有和和pos 函数搭配起来才会产生作用,对文字的文字进行调整
代码示例:
plot(1:5, 1:5, xlim = c(0,6), ylim = c (0,6), type = "n", main = "pos = 1")
abline(h = 3, v = 3 , col = "gray", lty = 3)
text(x = 3, y = 3, labels = "text", pos = 1, offset = 1, col = "red")
text(x = 3, y = 3, labels = "text", pos = 1, offset = -1, col = "blue")
效果图如下:
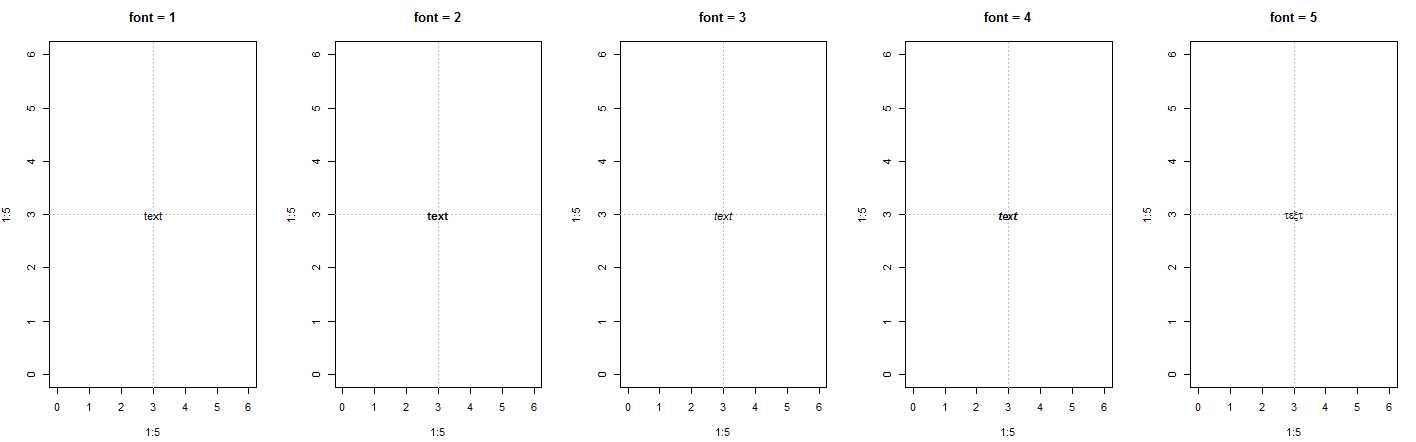
font: 设置文字的格式,1是默认值,就是普通的文字,2代表加粗,3代表斜体, 4代表加粗+斜体, 5只有用来ADOBE的设备上时,才有用
代码示例:
par(mfrow = c(1, 5))
plot(1:5, 1:5, xlim = c(0,6), ylim = c (0,6), type = "n", main = "font = 1")
abline(h = 3, v = 3 , col = "gray", lty = 3)
text(x = 3, y = 3, labels = "text", font = 1)
plot(1:5, 1:5, xlim = c(0,6), ylim = c (0,6), type = "n", main = "font = 2")
abline(h = 3, v = 3 , col = "gray", lty = 3)
text(x = 3, y = 3, labels = "text", font = 2)
plot(1:5, 1:5, xlim = c(0,6), ylim = c (0,6), type = "n", main = "font = 3")
abline(h = 3, v = 3 , col = "gray", lty = 3)
text(x = 3, y = 3, labels = "text", font = 3)
plot(1:5, 1:5, xlim = c(0,6), ylim = c (0,6), type = "n", main = "font = 4")
abline(h = 3, v = 3 , col = "gray", lty = 3)
text(x = 3, y = 3, labels = "text", font = 4)
plot(1:5, 1:5, xlim = c(0,6), ylim = c (0,6), type = "n", main = "font = 5")
abline(h = 3, v = 3 , col = "gray", lty = 3)
text(x = 3, y = 3, labels = "text", font = 5)
效果图如下:
text函数的常见用法和参数就参考上面的例子就够了,当我们想打印数学表达式或者一些特殊符号在图片上是,就需要对lables 参数进行特别设置
对于数据表达式,使用expression 函数将其转化成表达式后,在显示出来会更好
打印一个开平方的表达式,代码示例:
plot(1:5, 1:5, xlim = c(0,6), ylim = c (0,6), type = "n")
text(x = 3, y = 3, labels = expression(sqrt(x)))
效果图如下:
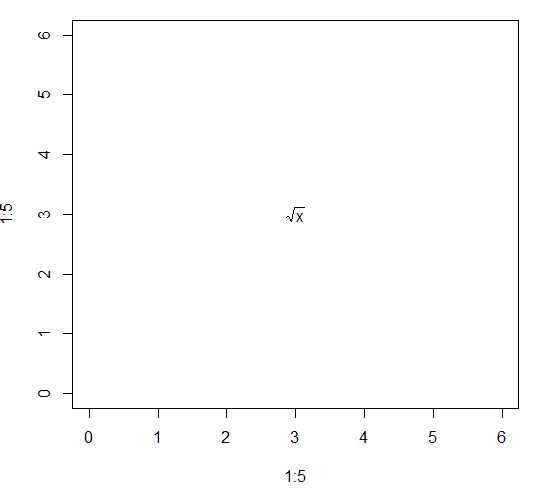
对于表达式的打印,具体的可以参考 plotmath 函数的帮助文档
标签:支持 基本用法 数据表 gray label src 文件 添加 文档
原文地址:http://www.cnblogs.com/xudongliang/p/6756780.html