标签:tool atp plt parent 技术 rom tick line python
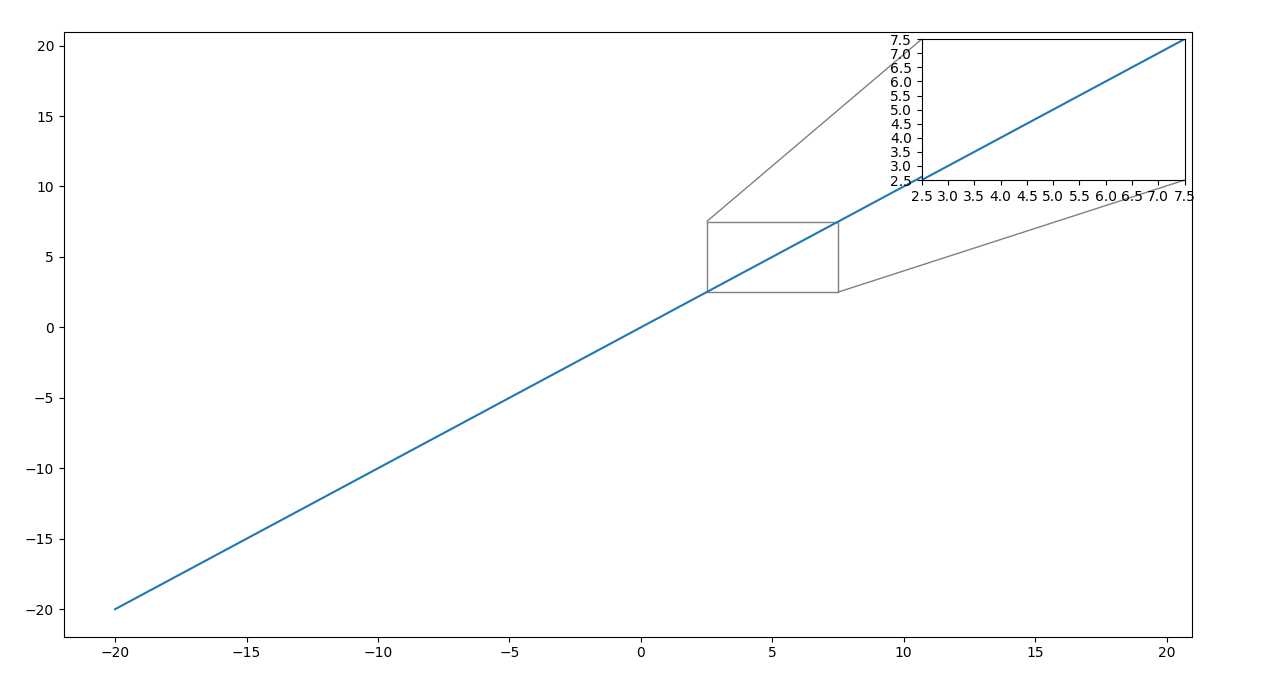
import matplotlib.pyplot as plt

from mpl_toolkits.axes_grid1.inset_locator import zoomed_inset_axes
from mpl_toolkits.axes_grid1.inset_locator import mark_inset

import numpy as np

fig, ax = plt.subplots(figsize=[5, 4])
y = x = range(-20,20)
ax.plot(x,y)
extent = [-3, 4, -4, 3]


axins = zoomed_inset_axes(ax, 2, loc=1)  # zoom = 6
axins.plot(x,y)

# sub region of the original image
x1, x2, y1, y2 = 2.5, 7.5, 2.5, 7.5
axins.set_xlim(x1, x2)
axins.set_ylim(y1, y2)
# fix the number of ticks on the inset axes
axins.yaxis.get_major_locator().set_params(nbins=10)
axins.xaxis.get_major_locator().set_params(nbins=10)

plt.xticks(visible=True)
plt.yticks(visible=True)

# draw a bbox of the region of the inset axes in the parent axes and
# connecting lines between the bbox and the inset axes area
mark_inset(ax, axins, loc1=2, loc2=4, fc="none", ec="0.5")

plt.draw()
plt.show()
标签:tool atp plt parent 技术 rom tick line python
原文地址:http://www.cnblogs.com/cppddz/p/6965368.html