标签:style blog http color os io 使用 java ar
Mvc Chart 是一个使用起来非常方便的控件,可以自定义参数,能呈现给用户很漂亮的各种统计图表;使用此图表首先要导入命名空间:System.Web.UI.DataVisualization.Charting
此dll在vs自带的里面,它的位置: C:\Program Files\Reference Assemblies\Microsoft\Framework\.NETFramework\v4.0\System.Web.DataVisualization.dll
效果图如下:

由于mvc 返回的是actionResult,而此图表chart返回的是图片,所以要封装一个ImageResult,如下:
 public class ImageResult : ActionResult
    {
        public ImageResult()
        { }

        public ImageResult(Image image)
        {
            Image = image;
        }

        public ImageResult(Image image, ImageFormat format)
        {
            Image = image;
            ImageFormat = format;
        }

        /// <summary>
        ///
        /// </summary>
        public Image Image { get; set; }

        /// <summary>
        /// 指定图像的文件格式
        /// </summary>
        public ImageFormat ImageFormat { get; set; }

        public override void ExecuteResult(ControllerContext context)
        {
            if (Image == null)
                throw new ArgumentNullException("Image");

            if (ImageFormat == null)
                throw new ArgumentNullException("ImageFormat");

            context.HttpContext.Response.Clear();

            if (ImageFormat.Equals(ImageFormat.Gif))
                context.HttpContext.Response.ContentType = "image/gif";
            else if (ImageFormat.Equals(ImageFormat.Jpeg))
                context.HttpContext.Response.ContentType = "image/jpeg";
            else if (ImageFormat.Equals(ImageFormat.Png))
                context.HttpContext.Response.ContentType = "image/png";
            else if (ImageFormat.Equals(ImageFormat.Bmp))
                context.HttpContext.Response.ContentType = "image/bmp";
            else if (ImageFormat.Equals(ImageFormat.Tiff))
                context.HttpContext.Response.ContentType = "image/tiff";
            else if (ImageFormat.Equals(ImageFormat.Icon))
                context.HttpContext.Response.ContentType = "image/vnd.microsoft.icon";
            else if (ImageFormat.Equals(ImageFormat.Wmf))
                context.HttpContext.Response.ContentType = "image/wmf";

            Image.Save(context.HttpContext.Response.OutputStream, ImageFormat);
        }
    }
后台代码如下:
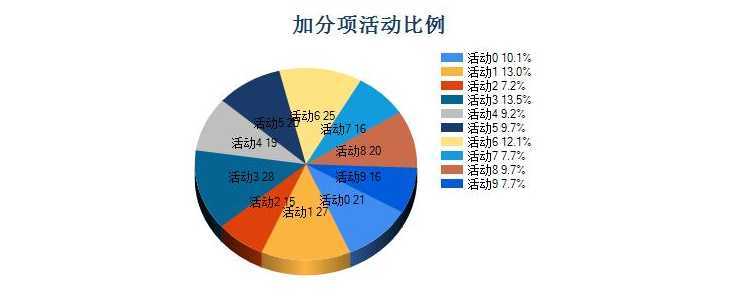
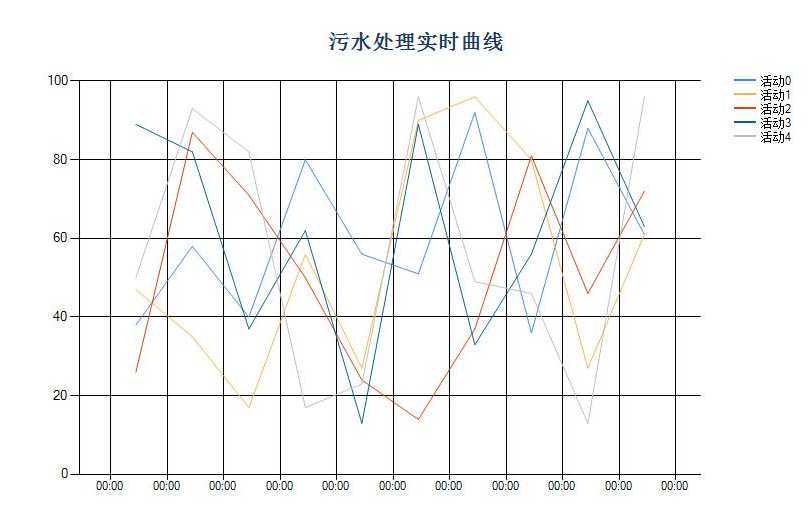
   #region MVC Chart

        public ActionResult MVCChart()
        {
            return View();
        }

        public ActionResult ChartView()
        {
            return PartialView();
        }
        public ActionResult ZhuChart()
        {
            System.Web.UI.DataVisualization.Charting.Chart chart = new System.Web.UI.DataVisualization.Charting.Chart();
            chart.Width = 750;
            chart.Height = 400;
            chart.RenderType = RenderType.ImageTag;
            chart.Palette = ChartColorPalette.BrightPastel;
            Title t = new Title("活动数量分布", Docking.Top, new System.Drawing.Font("Trebuchet MS", 14, System.Drawing.FontStyle.Bold), System.Drawing.Color.FromArgb(26, 59, 105));
            chart.Titles.Add(t);

            chart.ChartAreas.Add("Subject");
            chart.ChartAreas[0].AxisX.Interval = 1;   //设置X轴坐标的间隔为1
            chart.ChartAreas[0].AxisX.IntervalOffset = 1;  //设置X轴坐标偏移为1
            chart.ChartAreas[0].AxisX.LabelStyle.IsStaggered = false;   //设置是否交错显示,比如数据多的时间分成两行来显示

            chart.Series.Add("Subject");

            chart.Series["Subject"].Label = "#VAL";
            chart.Series["Subject"].LegendText = "活动数量";

            List<string> actives = new List<string>();
            for (int i = 0; i < 10; i++)
            {
                actives.Add("活动" + i.ToString());
            }
            Random rd = new Random();

            foreach (var item in actives)
            {
                chart.Series["Subject"].Points.AddXY(item, rd.Next(50, 80));
            }

            chart.BorderSkin.SkinStyle = BorderSkinStyle.Emboss;
            chart.BorderColor = System.Drawing.Color.FromArgb(26, 59, 105);
            chart.BorderlineDashStyle = ChartDashStyle.Solid;
            chart.BorderWidth = 2;
            // chart.BackColor = Color.Green;
            chart.Legends.Add("Legend1");

            MemoryStream stream = new MemoryStream();
            chart.SaveImage(stream, ChartImageFormat.Jpeg);

            return new ImageResult(Image.FromStream(stream), ImageFormat.Jpeg);
        }

        public ActionResult pieChart()
        {
            List<string> xValues = new List<string>();
            List<string> yValues = new List<string>();
            List<string> actives = new List<string>();
            for (int i = 0; i < 10; i++)
            {
                actives.Add("活动" + i.ToString());
            }
            Random rd = new Random();

            foreach (var item in actives)
            {
                xValues.Add(item);
                yValues.Add(rd.Next(10, 30).ToString());
            }

            System.Web.UI.DataVisualization.Charting.Chart pieChar = new System.Web.UI.DataVisualization.Charting.Chart();
            pieChar.Series.Add("Default");
            pieChar.Series["Default"].Points.DataBindXY(xValues, yValues);
            pieChar.Series["Default"].Label = "#AXISLABEL #VAL";
            pieChar.Series["Default"].LegendText = "#AXISLABEL #PERCENT{P1}";
            Title pieTitle = new Title("加分项活动比例", Docking.Top, new System.Drawing.Font("Trebuchet MS", 14, System.Drawing.FontStyle.Bold), System.Drawing.Color.FromArgb(26, 59, 105));
            pieChar.Titles.Add(pieTitle);

            pieChar.Width = 380;
            // Set Doughnut chart type
            pieChar.Series["Default"].ChartType = SeriesChartType.Pie;
            // Set labels style
            pieChar.Series["Default"]["PieLabelStyle"] = "Inside";
            // Set Doughnut radius percentage
            pieChar.Series["Default"]["DoughnutRadius"] = "70";
            // Explode data point with label "Italy"
            //pieChar.Series["Default"].Points[4]["Exploded"] = "true";
            // Enable 3D
            pieChar.ChartAreas.Add("ChartArea1");
            pieChar.ChartAreas["ChartArea1"].Area3DStyle.Enable3D = true;

            // Disable the Legend
            pieChar.Legends.Add("Lengenedpie");
            pieChar.Legends[0].Enabled = true;

            MemoryStream stream = new MemoryStream();
            pieChar.SaveImage(stream, ChartImageFormat.Jpeg);

            return new ImageResult(Image.FromStream(stream), ImageFormat.Jpeg);
        }

        public ActionResult lineChart()
        {
            System.Web.UI.DataVisualization.Charting.Chart chart = new System.Web.UI.DataVisualization.Charting.Chart();
            chart.Width = 830;
            chart.Height = 500;
            chart.RenderType = RenderType.ImageTag;
            chart.Palette = ChartColorPalette.BrightPastel;
            Title t = new Title("污水处理实时曲线", Docking.Top, new System.Drawing.Font("Trebuchet MS", 14, System.Drawing.FontStyle.Bold), System.Drawing.Color.FromArgb(26, 59, 105));
            chart.Titles.Add(t);
            chart.ChartAreas.Add("Default");

            List<string> actives = new List<string>();
            for (int i = 0; i < 5; i++)
            {
                actives.Add("活动" + i.ToString());
            }

            Random rd = new Random();
            foreach (var item in actives)
            {
                chart.Series.Add(item.ToString());


                chart.Series[item.ToString()].LegendText = item;
                chart.Series[item.ToString()].ChartType = SeriesChartType.Line;
                chart.Series[item.ToString()].XValueType = ChartValueType.DateTime;

                for (int i = 0; i < 10; i++)
                {
                    chart.Series[item.ToString()].Points.AddXY(DateTime.Now.AddDays(0 - i).ToOADate(), rd.Next(10, 100));
                }
            }

            chart.ChartAreas["Default"].AxisX.LabelStyle.IsStaggered = false;
            chart.ChartAreas["Default"].AxisX.LabelStyle.Format = "HH:mm";

            chart.BorderColor = System.Drawing.Color.FromArgb(26, 59, 105);
            chart.BorderlineDashStyle = ChartDashStyle.Solid;
            chart.BorderWidth = 2;
            chart.Legends.Add("Legend1");
            chart.ChartAreas["Default"].AxisX.IntervalAutoMode = IntervalAutoMode.VariableCount;

            MemoryStream stream = new MemoryStream();
            chart.SaveImage(stream, ChartImageFormat.Jpeg);
            return new ImageResult(Image.FromStream(stream), ImageFormat.Jpeg);
        }
        #endregion
前台页面加载图表可以用ajax,代码如下:
MVCChart 页面的代码:

@{
    ViewBag.Title = "MVCChart";
}
<script type="text/javascript">
    $(function () {
        loadChart();
    })

    function loadChart() {
        $("#zhu").load("/Report/ChartView");
    }
</script>
<div id="zhu" style="width:100%"></div>

ChartView的页面代码:

@{
    ViewBag.Title = "ZhuView";
}
<table style="width: 100%">
    <tr>
        <td>
            <img src="@Url.Action("ZhuChart")" alt="柱状图"/>
        </td>
    </tr>
    <tr>
        <td>
            <img src="@Url.Action("pieChart")" alt="饼状图"/>
        </td>
    </tr>
    <tr>
        <td>
            <img src="@Url.Action("lineChart")" alt="曲线图"/>
        </td>
    </tr>
</table>
标签:style blog http color os io 使用 java ar
原文地址:http://www.cnblogs.com/wangchengshen/p/3950963.html