标签:ids ges highlight lin min div nes 实战 jit
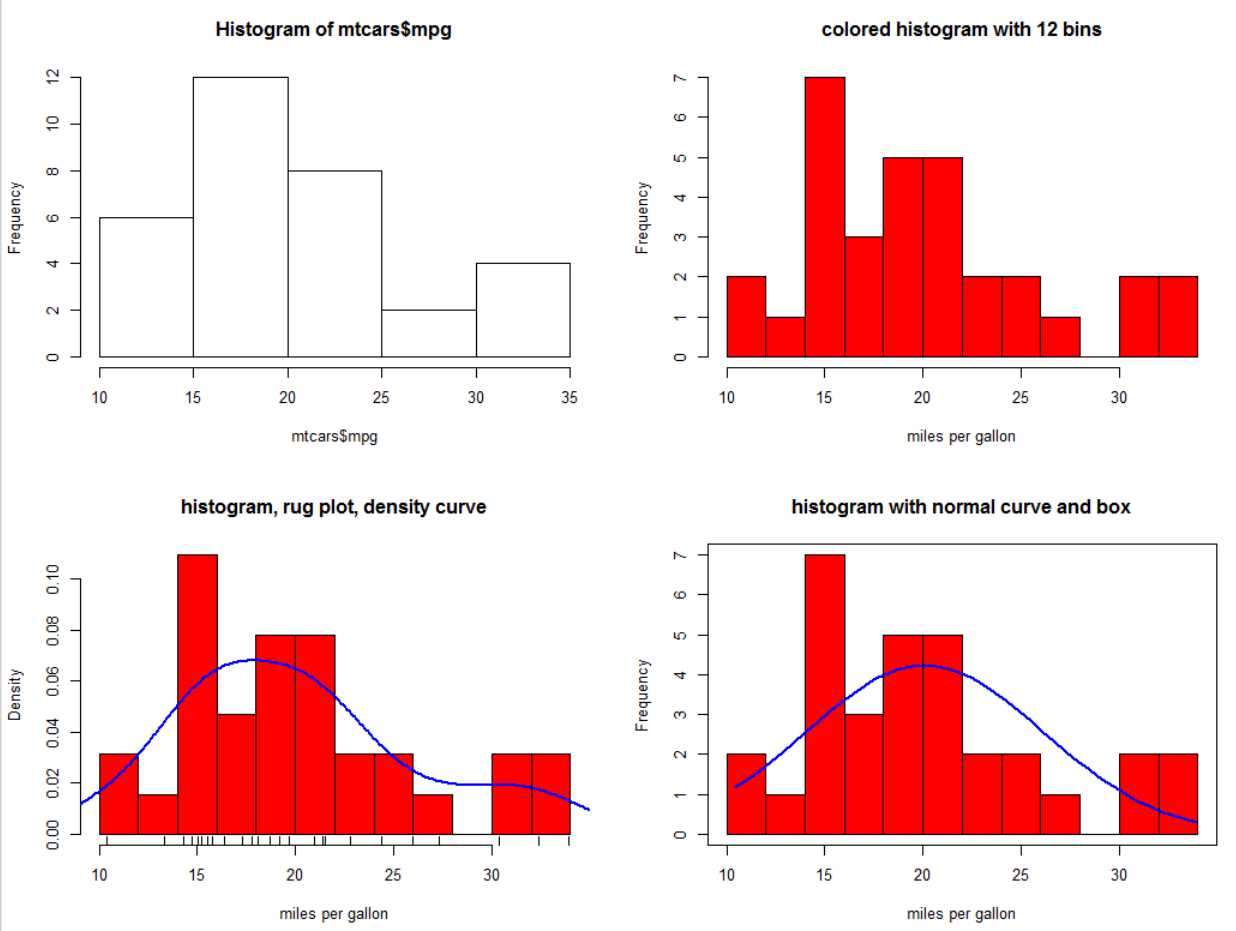
> par(mfrow=c(2, 2))
>
> hist(mtcars$mpg)
>
> hist(mtcars$mpg, breaks=12, col="red", xlab="miles per gallon",
+      main="colored histogram with 12 bins")
>
> hist(mtcars$mpg, freq=FALSE, breaks=12, col="red", xlab="miles per gallon",
+      main="histogram, rug plot, density curve")
> rug(jitter(mtcars$mpg))
> lines(density(mtcars$mpg), col="blue", lwd=2)
>
> x <- mtcars$mpg
> h <- hist(x, breaks=12, col="red", xlab="miles per gallon",
+           main="histogram with normal curve and box")
> xfit <- seq(min(x), max(x), length=40)
> yfit <- dnorm(xfit, mean=mean(x), sd=sd(x))
> yfit <- yfit*diff(h$mids[1:2])*length(x)
> lines(xfit, yfit, col="blue", lwd=2)
> box()
>
标签:ids ges highlight lin min div nes 实战 jit
原文地址:http://www.cnblogs.com/wnzhong/p/7588923.html