标签:dashboard monitor uid logs 之一 and setting hive http
本节内容:
可选的方案:
本篇文章介绍的是Heapster + InfluxDB + Grafana,kubernetes集群(1.6.0)搭建见前面的文章。
开源软件cAdvisor(Container cAdvisor)是用于监控容器运行状态的利器之一(cAdvisor项目的主页为https://github.com/cAdvisor),它被用于多个与Docker相关的开源项目中。
在kubernetes系统中,cAdvisor已经被默认集成到了kubelet组件内,当kubelet服务启动时,它会自动启动cAdvisor服务,然后cAdvisor会实时采集所在节点的性能指标及节点上运行的容器的性能指标。kubelet的启动参数--cadvisor-port可自定义cAdvisor对外提供服务的端口号,默认是4194。
cAdvisor提供了web页面可供浏览器访问,例如本kubernetes集群中的一个Node的ip是172.16.7.151,那么浏览器输入http://172.16.7.151:4194可以访问cAdvisor的监控页面。cAdvisor主页显示了主机的实时运行状态,包括CPU使用情况、内存使用情况、网络吞吐量及文件系统使用情况等信息。
但是cAdvisor只提供了单机的容器资源占用情况,而在大规模容器集群中,需要对所有的Node和全部容器进行性能监控。这就需要一套工具来实现集群性能数据的采集、存储和展示:Heapster、InfluxDB和Grafana。
Heapster提供了整个集群的资源监控,并支持持久化数据存储到InfluxDB、Google Cloud Monitoring或者其他的存储后端。Heapster从kubelet提供的API采集节点和容器的资源占用。另外,Heapster的 /metrics API提供了Prometheus格式的数据。
InfluxDB是一个开源分布式时序、事件和指标数据库;而Grafana则是InfluxDB的 dashboard,提供了强大的图表展示功能。它们常被组合使用展示图表化的监控数据。
Heapster、InfluxDB和Grafana均以Pod的形式启动和运行,其中Heapster需要与Kubernetes Master进行安全连接。
到 heapster release 页面 下载heapster。
[root@node1 opt]# wget https://github.com/kubernetes/heapster/archive/v1.3.0.zip
[root@node1 opt]# unzip v1.3.0.zip
[root@node1 opt]# cd heapster-1.3.0/deploy/kube-config/influxdb
[root@node1 influxdb]# ls *.yaml
grafana-deployment.yaml  heapster-deployment.yaml  influxdb-deployment.yaml
grafana-service.yaml     heapster-service.yaml     influxdb-service.yaml
1. 创建文件heapster-rbac.yaml

[root@node1 influxdb]# vim heapster-rbac.yaml
apiVersion: v1
kind: ServiceAccount
metadata:
  name: heapster
  namespace: kube-system

---

kind: ClusterRoleBinding
apiVersion: rbac.authorization.k8s.io/v1beta1
metadata:
  name: heapster
subjects:
  - kind: ServiceAccount
    name: heapster
    namespace: kube-system
roleRef:
  kind: ClusterRole
  name: cluster-admin
  apiGroup: rbac.authorization.k8s.io
2. 修改 grafana-deployment.yaml
[root@node1 influxdb]# vim grafana-deployment.yaml
apiVersion: extensions/v1beta1
kind: Deployment
metadata:
  name: monitoring-grafana
  namespace: kube-system
spec:
  replicas: 1
  template:
    metadata:
      labels:
        task: monitoring
        k8s-app: grafana
    spec:
      containers:
      - name: grafana
        image: index.tenxcloud.com/jimmy/heapster-grafana-amd64:v4.0.2
        ports:
          - containerPort: 3000
            protocol: TCP
        volumeMounts:
        - mountPath: /var
          name: grafana-storage
        env:
        - name: INFLUXDB_HOST
          value: monitoring-influxdb
        - name: GRAFANA_PORT
          value: "3000"
          # The following env variables are required to make Grafana accessible via
          # the kubernetes api-server proxy. On production clusters, we recommend
          # removing these env variables, setup auth for grafana, and expose the grafana
          # service using a LoadBalancer or a public IP.
        - name: GF_AUTH_BASIC_ENABLED
          value: "false"
        - name: GF_AUTH_ANONYMOUS_ENABLED
          value: "true"
        - name: GF_AUTH_ANONYMOUS_ORG_ROLE
          value: Admin
        - name: GF_SERVER_ROOT_URL
          # If you‘re only using the API Server proxy, set this value instead:
          value: /api/v1/proxy/namespaces/kube-system/services/monitoring-grafana/
          #value: /
      volumes:
      - name: grafana-storage
        emptyDir: {}
【说明】:
3. 修改heapster-deployment.yaml
[root@node1 influxdb]# vim heapster-deployment.yaml
apiVersion: extensions/v1beta1
kind: Deployment
metadata:
  name: heapster
  namespace: kube-system
spec:
  replicas: 1
  template:
    metadata:
      labels:
        task: monitoring
        k8s-app: heapster
    spec:
      serviceAccountName: heapster
      containers:
      - name: heapster
        image: index.tenxcloud.com/jimmy/heapster-amd64:v1.3.0-beta.1
        imagePullPolicy: IfNotPresent
        command:
        - /heapster
        - --source=kubernetes:https://kubernetes.default
        - --sink=influxdb:http://monitoring-influxdb:8086
【说明】:Heapster需要设置的启动参数如下:
其他参数可以通过进入heapster容器执行 # heapster --help 命令查看和设置。
【注意】:URL中的主机名地址使用的是InfluxDB的Service名字,这需要DNS服务正常工作,如果没有配置DNS服务,则也可以使用Service的ClusterIP地址。
另外,InfluxDB服务的名称没有加上命名空间,是因为Heapster服务与InfluxDB服务属于相同的命名空间kube-system。也可以使用上命名空间的全服务名,例如:http://monitoring-influxdb.kube-system:8086
4. 修改 influxdb-deployment.yaml
influxdb 官方建议使用命令行或 HTTP API 接口来查询数据库,从 v1.1.0 版本开始默认关闭 admin UI,将在后续版本中移除 admin UI 插件。
开启镜像中 admin UI的办法如下:先导出镜像中的 influxdb 配置文件,开启 admin 插件后,再将配置文件内容写入 ConfigMap,最后挂载到镜像中,达到覆盖原始配置的目的。
# 导出镜像中的 influxdb 配置文件
[root@node1 influxdb]# docker run --rm --entrypoint ‘cat‘  -ti lvanneo/heapster-influxdb-amd64:v1.1.1 /etc/config.toml >config.toml.orig
[root@node1 influxdb]# cp config.toml.orig config.toml
# 修改配置:启用 admin 接口
[root@node1 influxdb]# vim config.toml
[admin]
  enabled = true
# 将修改后的配置写入到 ConfigMap 对象中(kubectl 可以通过 --namespace 或者 -n 选项指定namespace。如果不指定, 默认为default)
[root@node1 influxdb]# kubectl create configmap influxdb-config --from-file=config.toml -n kube-system
configmap "influxdb-config" created
修改influxdb-deployment.yaml:
[root@node1 influxdb]# vim influxdb-deployment.yaml
apiVersion: extensions/v1beta1
kind: Deployment
metadata:
  name: monitoring-influxdb
  namespace: kube-system
spec:
  replicas: 1
  template:
    metadata:
      labels:
        task: monitoring
        k8s-app: influxdb
    spec:
      containers:
      - name: influxdb
        image: index.tenxcloud.com/jimmy/heapster-influxdb-amd64:v1.1.1
        volumeMounts:
        - mountPath: /data
          name: influxdb-storage
        - mountPath: /etc/
          name: influxdb-config
      volumes:
      - name: influxdb-storage
        emptyDir: {}
      - name: influxdb-config
        configMap:
          name: influxdb-config
5. 修改 influxdb-service.yaml
[root@node1 influxdb]# vim influxdb-service.yaml
apiVersion: v1
kind: Service
metadata:
  labels:
    task: monitoring
    # For use as a Cluster add-on (https://github.com/kubernetes/kubernetes/tree/master/cluster/addons)
    # If you are NOT using this as an addon, you should comment out this line.
    kubernetes.io/cluster-service: ‘true‘
    kubernetes.io/name: monitoring-influxdb
  name: monitoring-influxdb
  namespace: kube-system
spec:
  type: NodePort
  ports:
  - port: 8086
    targetPort: 8086
    name: http
  - port: 8083
    targetPort: 8083
    name: admin
  selector:
    k8s-app: influxdb
【说明】:
6. 执行所有定义文件进行安装
[root@node1 influxdb]# pwd
/opt/heapster-1.3.0/deploy/kube-config/influxdb
[root@node1 influxdb]# ls
grafana-deployment.yaml  heapster-deployment.yaml  heapster-service.yaml  influxdb-deployment.yaml
grafana-service.yaml     heapster-rbac.yaml        influxdb-cm.yaml       influxdb-service.yaml
[root@node1 influxdb]# kubectl create -f .
deployment "monitoring-grafana" created
service "monitoring-grafana" created
deployment "heapster" created
serviceaccount "heapster" created
clusterrolebinding "heapster" created
service "heapster" created
deployment "monitoring-influxdb" created
service "monitoring-influxdb" created
7. 检查执行结果
(1)检查 Deployment
# kubectl get deployments -n kube-system | grep -E ‘heapster|monitoring‘
heapster               1         1         1            1           12m
monitoring-grafana     1         1         1            1           12m
monitoring-influxdb    1         1         1            1           12m
(2)检查 Pods
# kubectl get pods -n kube-system | grep -E ‘heapster|monitoring‘
heapster-2291216627-6hv9s               1/1       Running   0          10m
monitoring-grafana-2490289118-n54fk     1/1       Running   0          10m
monitoring-influxdb-1450237832-029q8    1/1       Running   0          10m
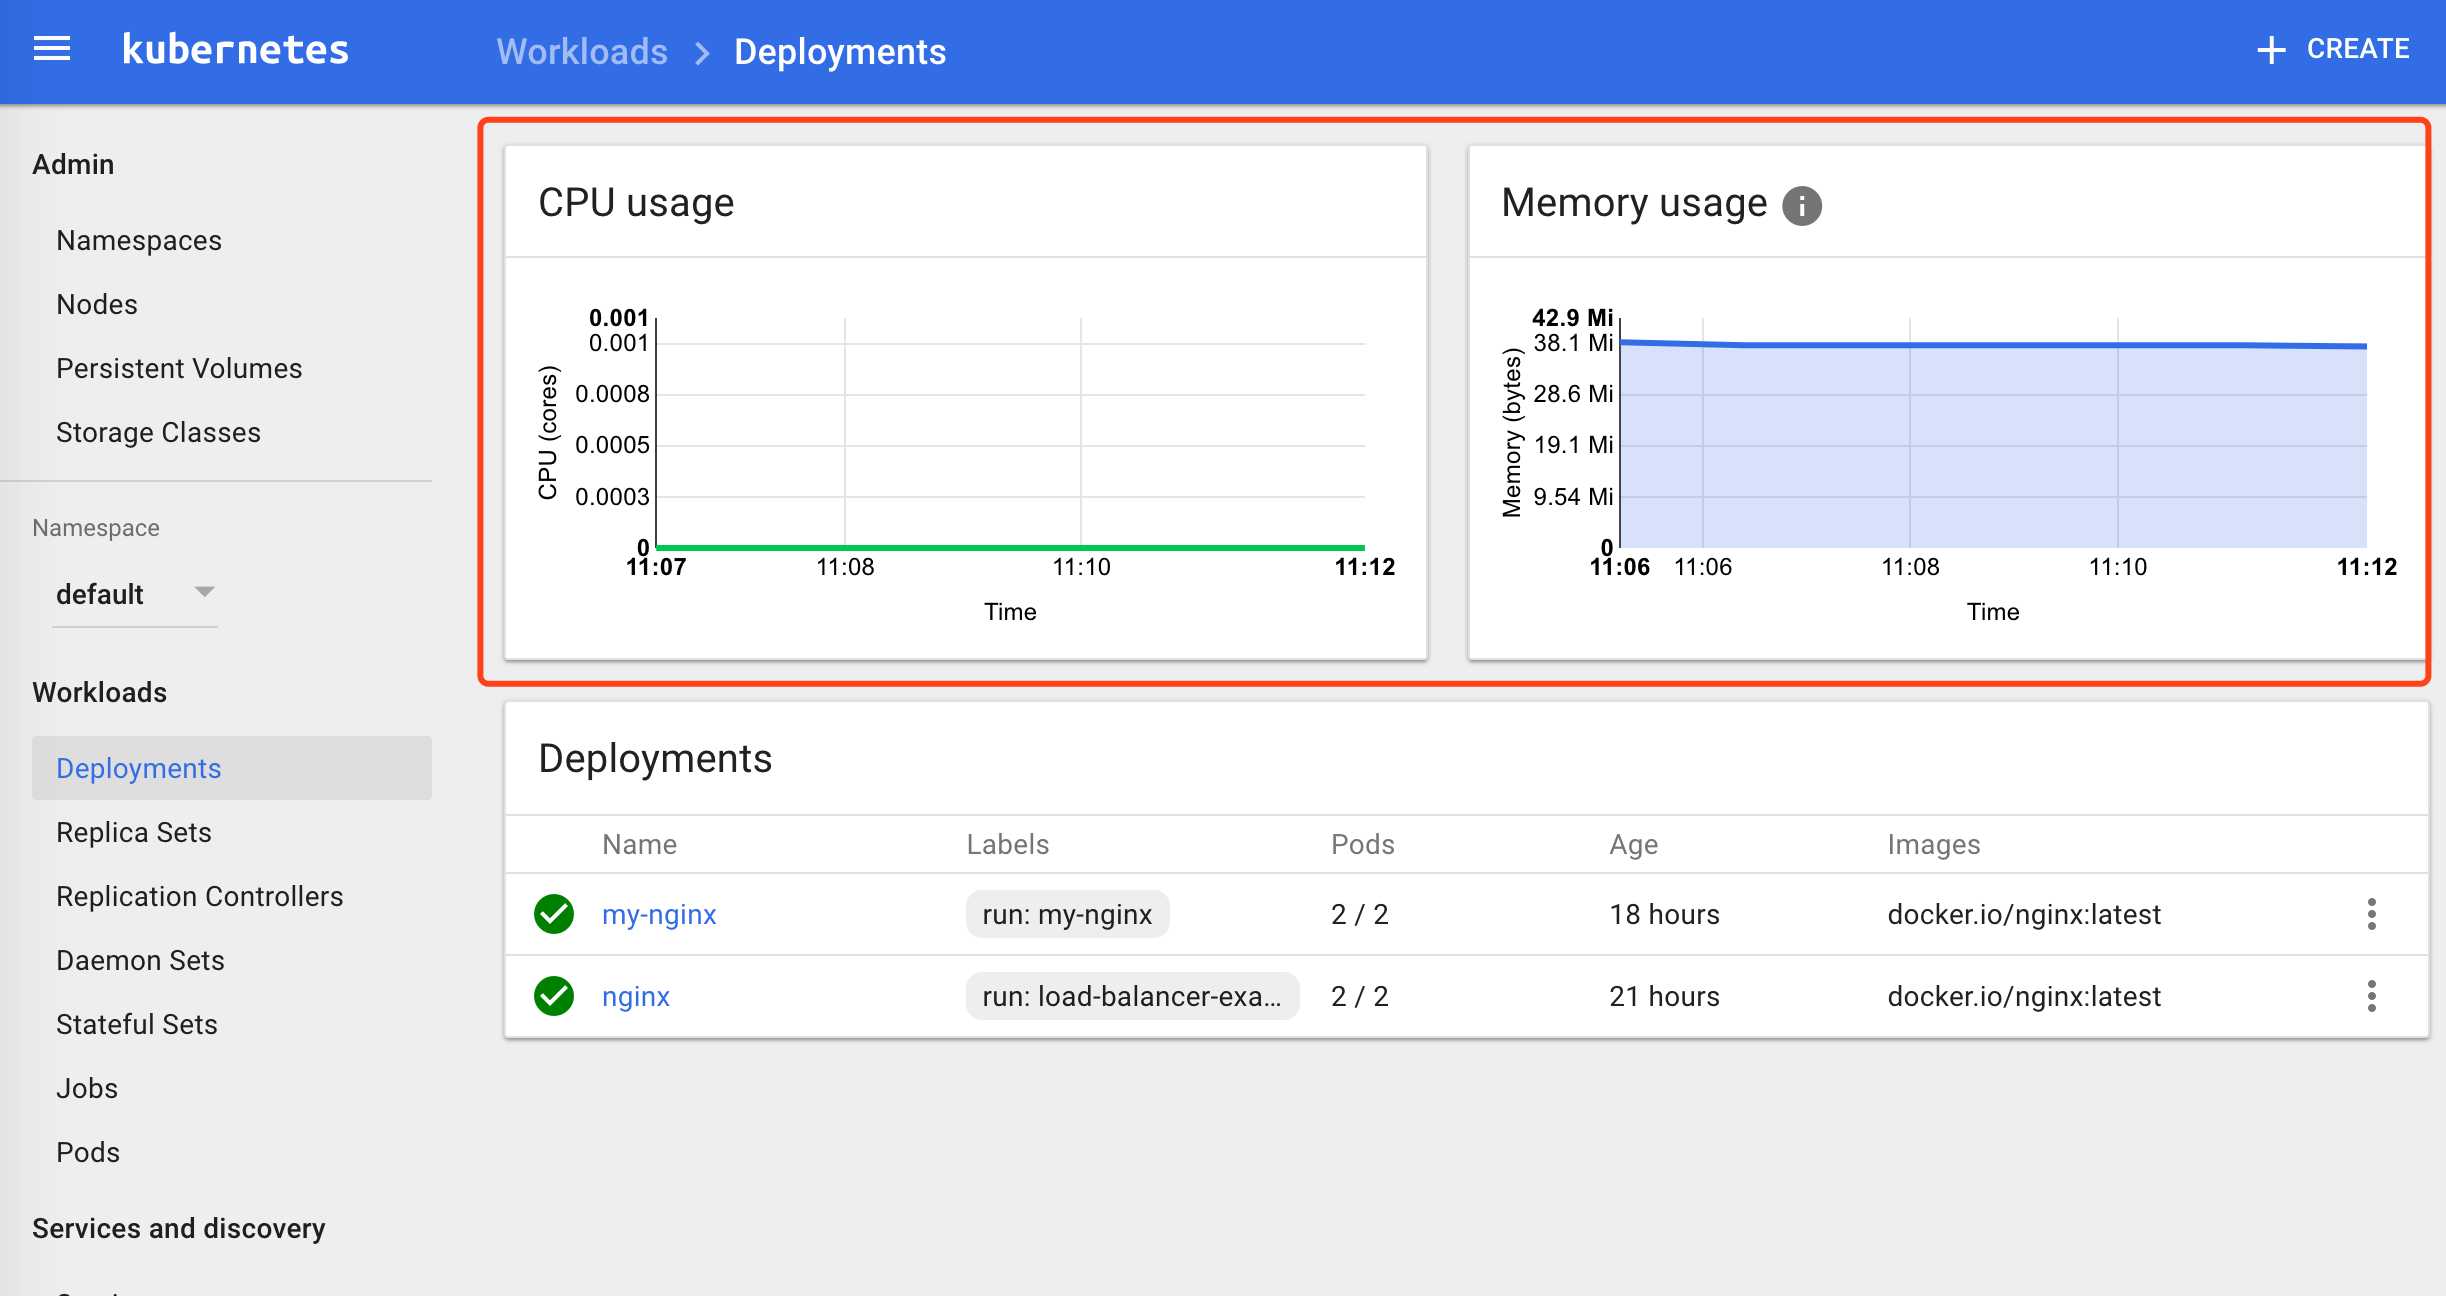
(3)检查 kubernets dashboard 界面,看是显示各 Nodes、Pods 的 CPU、内存、负载等利用率曲线图
1. 通过 kube-apiserver 访问
获取 monitoring-grafana 服务 URL:
[root@node1 influxdb]# kubectl cluster-info
Kubernetes master is running at https://172.16.7.151:6443
Heapster is running at https://172.16.7.151:6443/api/v1/proxy/namespaces/kube-system/services/heapster
KubeDNS is running at https://172.16.7.151:6443/api/v1/proxy/namespaces/kube-system/services/kube-dns
kubernetes-dashboard is running at https://172.16.7.151:6443/api/v1/proxy/namespaces/kube-system/services/kubernetes-dashboard
monitoring-grafana is running at https://172.16.7.151:6443/api/v1/proxy/namespaces/kube-system/services/monitoring-grafana
monitoring-influxdb is running at https://172.16.7.151:6443/api/v1/proxy/namespaces/kube-system/services/monitoring-influxdb

To further debug and diagnose cluster problems, use ‘kubectl cluster-info dump‘.
浏览器访问 URL: http://172.16.7.151:8080/api/v1/proxy/namespaces/kube-system/services/monitoring-grafana
2. 通过 kubectl proxy 访问
创建代理:
# kubectl proxy --address=‘172.16.7.151‘ --port=8086 --accept-hosts=‘^*$‘
浏览器访问 URL:http://172.16.7.151:8086/api/v1/proxy/namespaces/kube-system/services/monitoring-grafana
3. Grafana页面查看和操作
浏览器访问 URL: http://172.16.7.151:8080/api/v1/proxy/namespaces/kube-system/services/monitoring-grafana
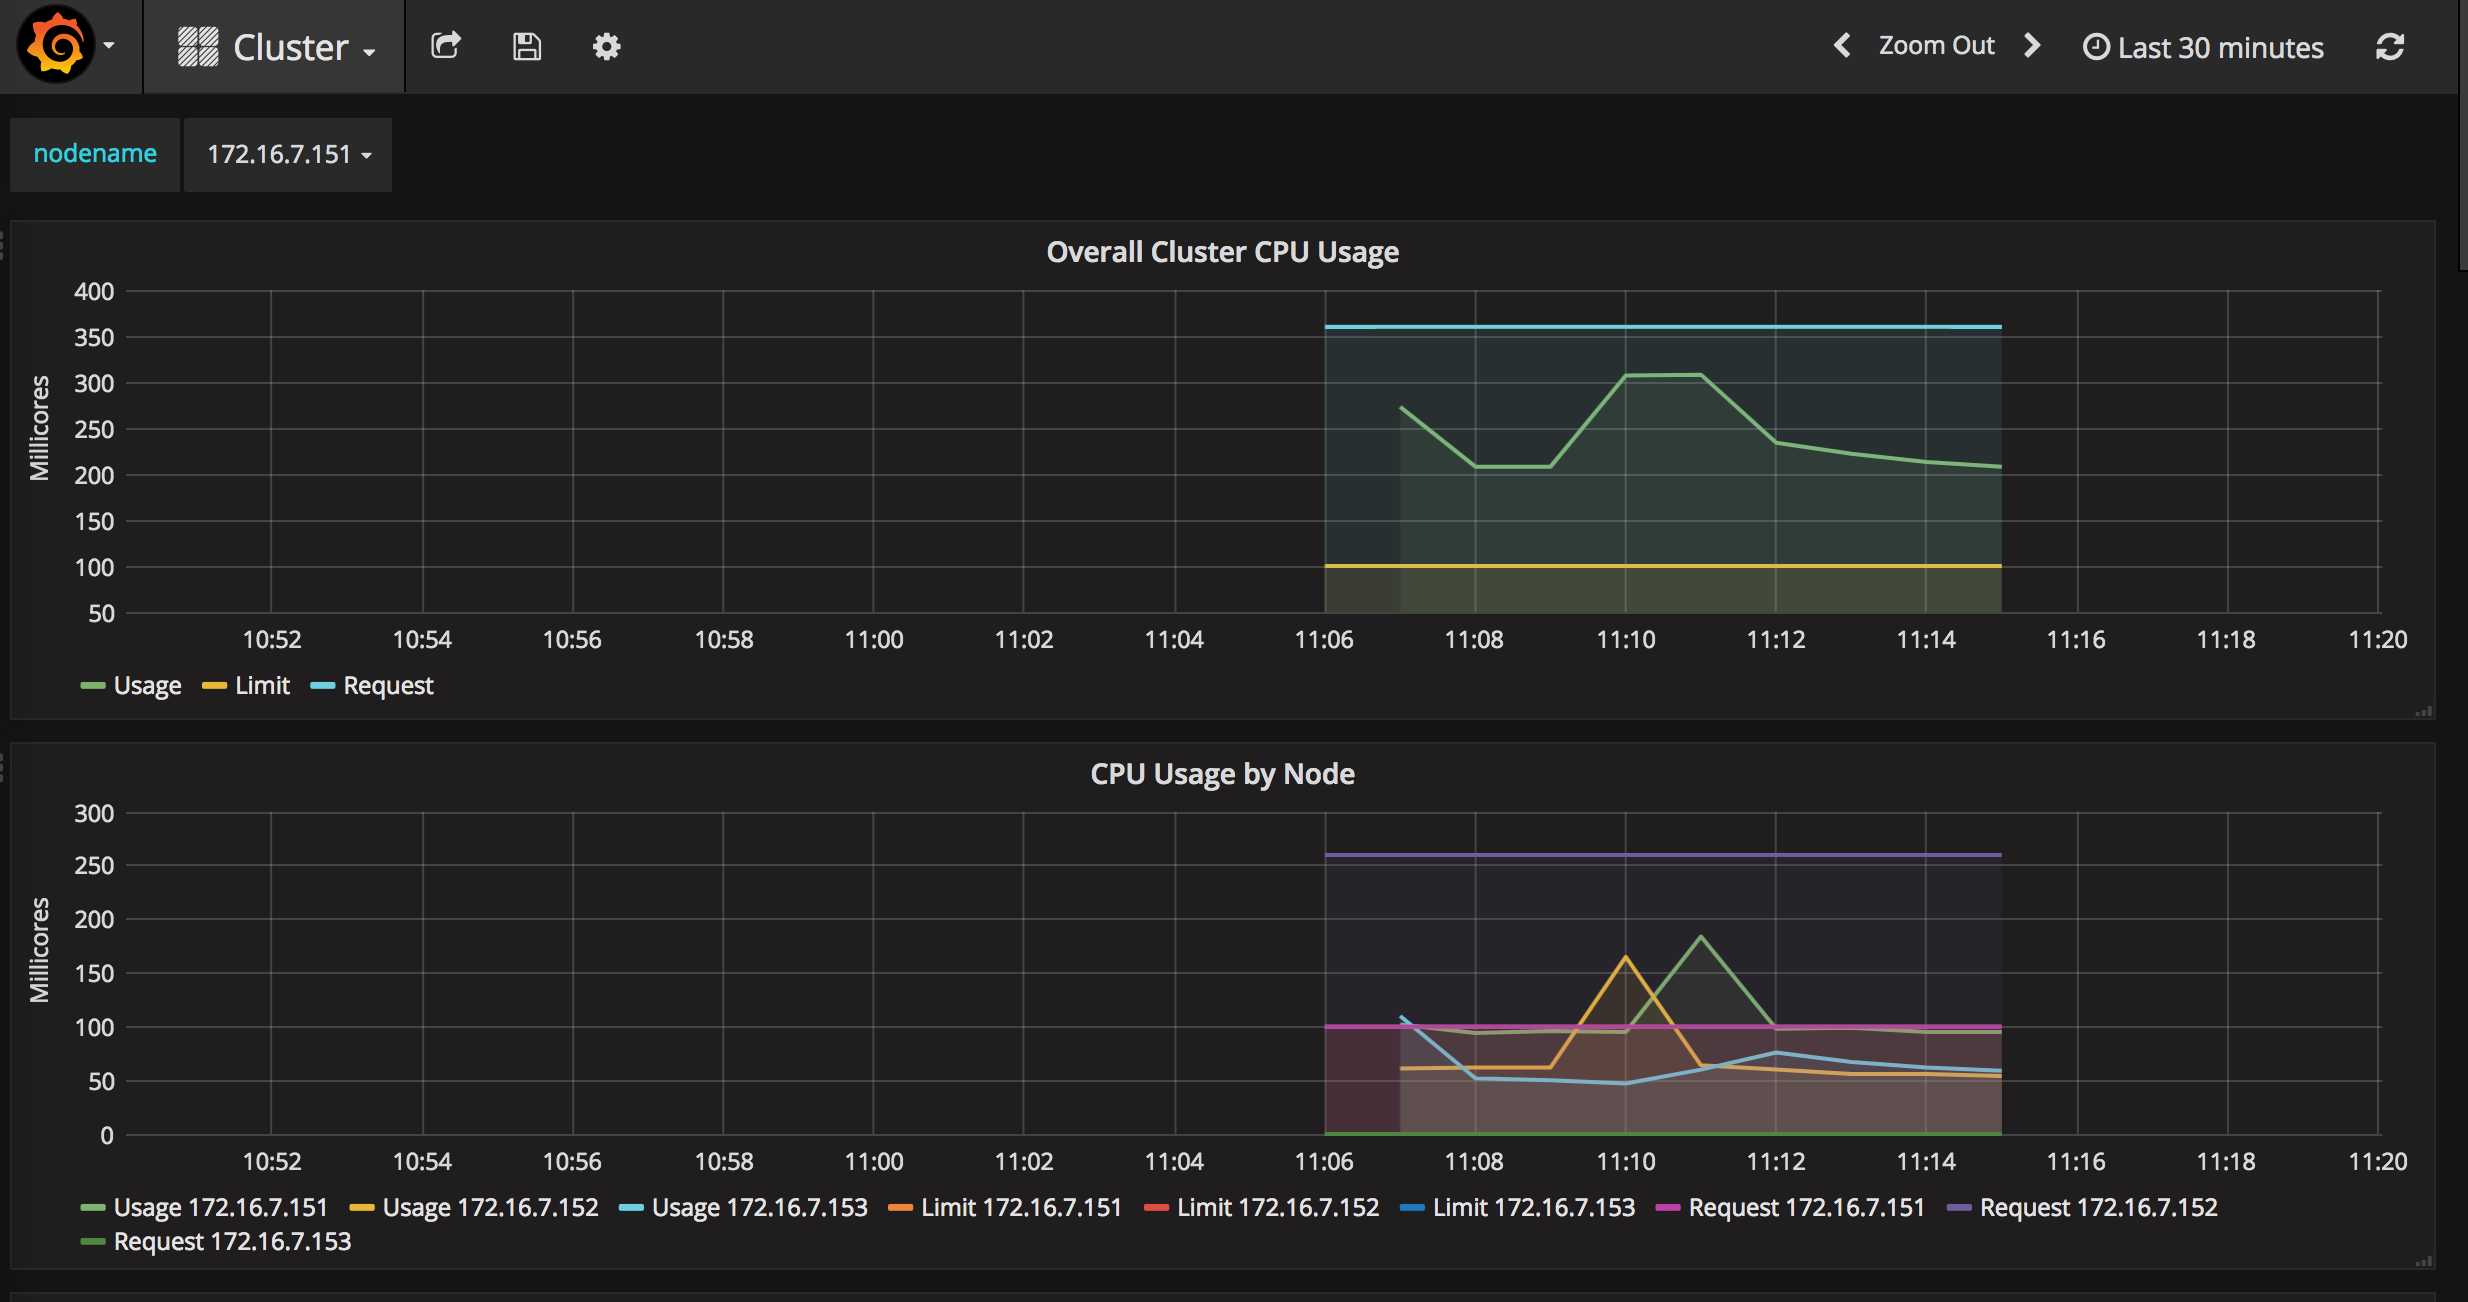
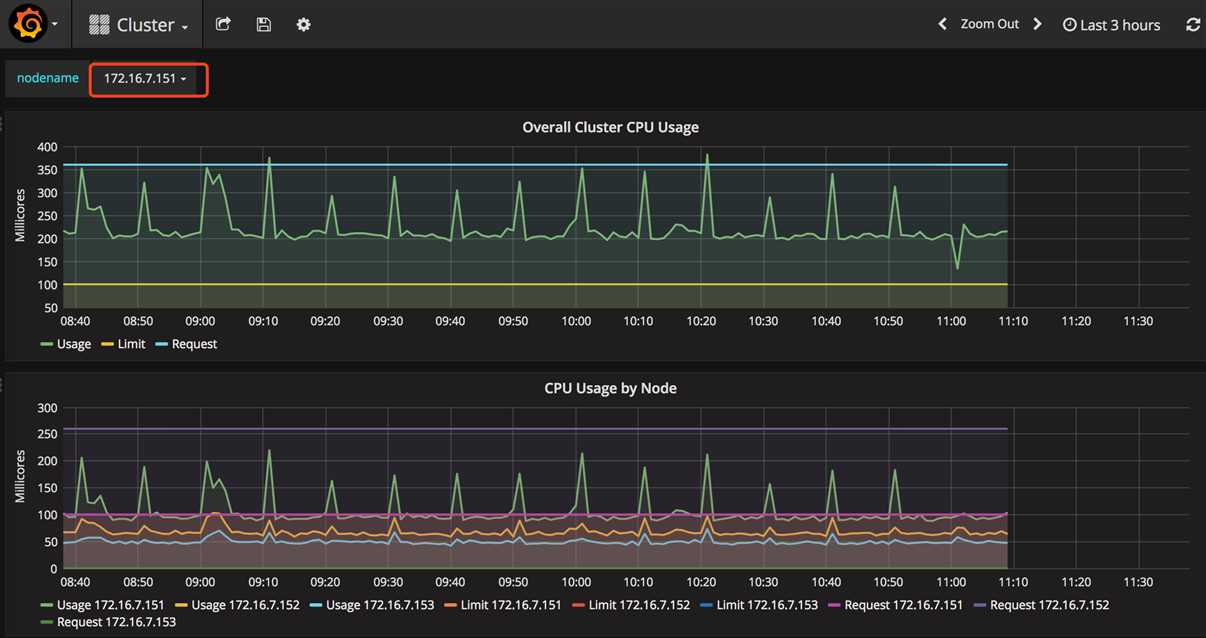
点击“Home”下拉列表,选择cluster,如下图。图中显示了Cluster集群的整体信息,以折线图的形式展示了集群范围内各Node的CPU使用率、内存使用情况等信息。
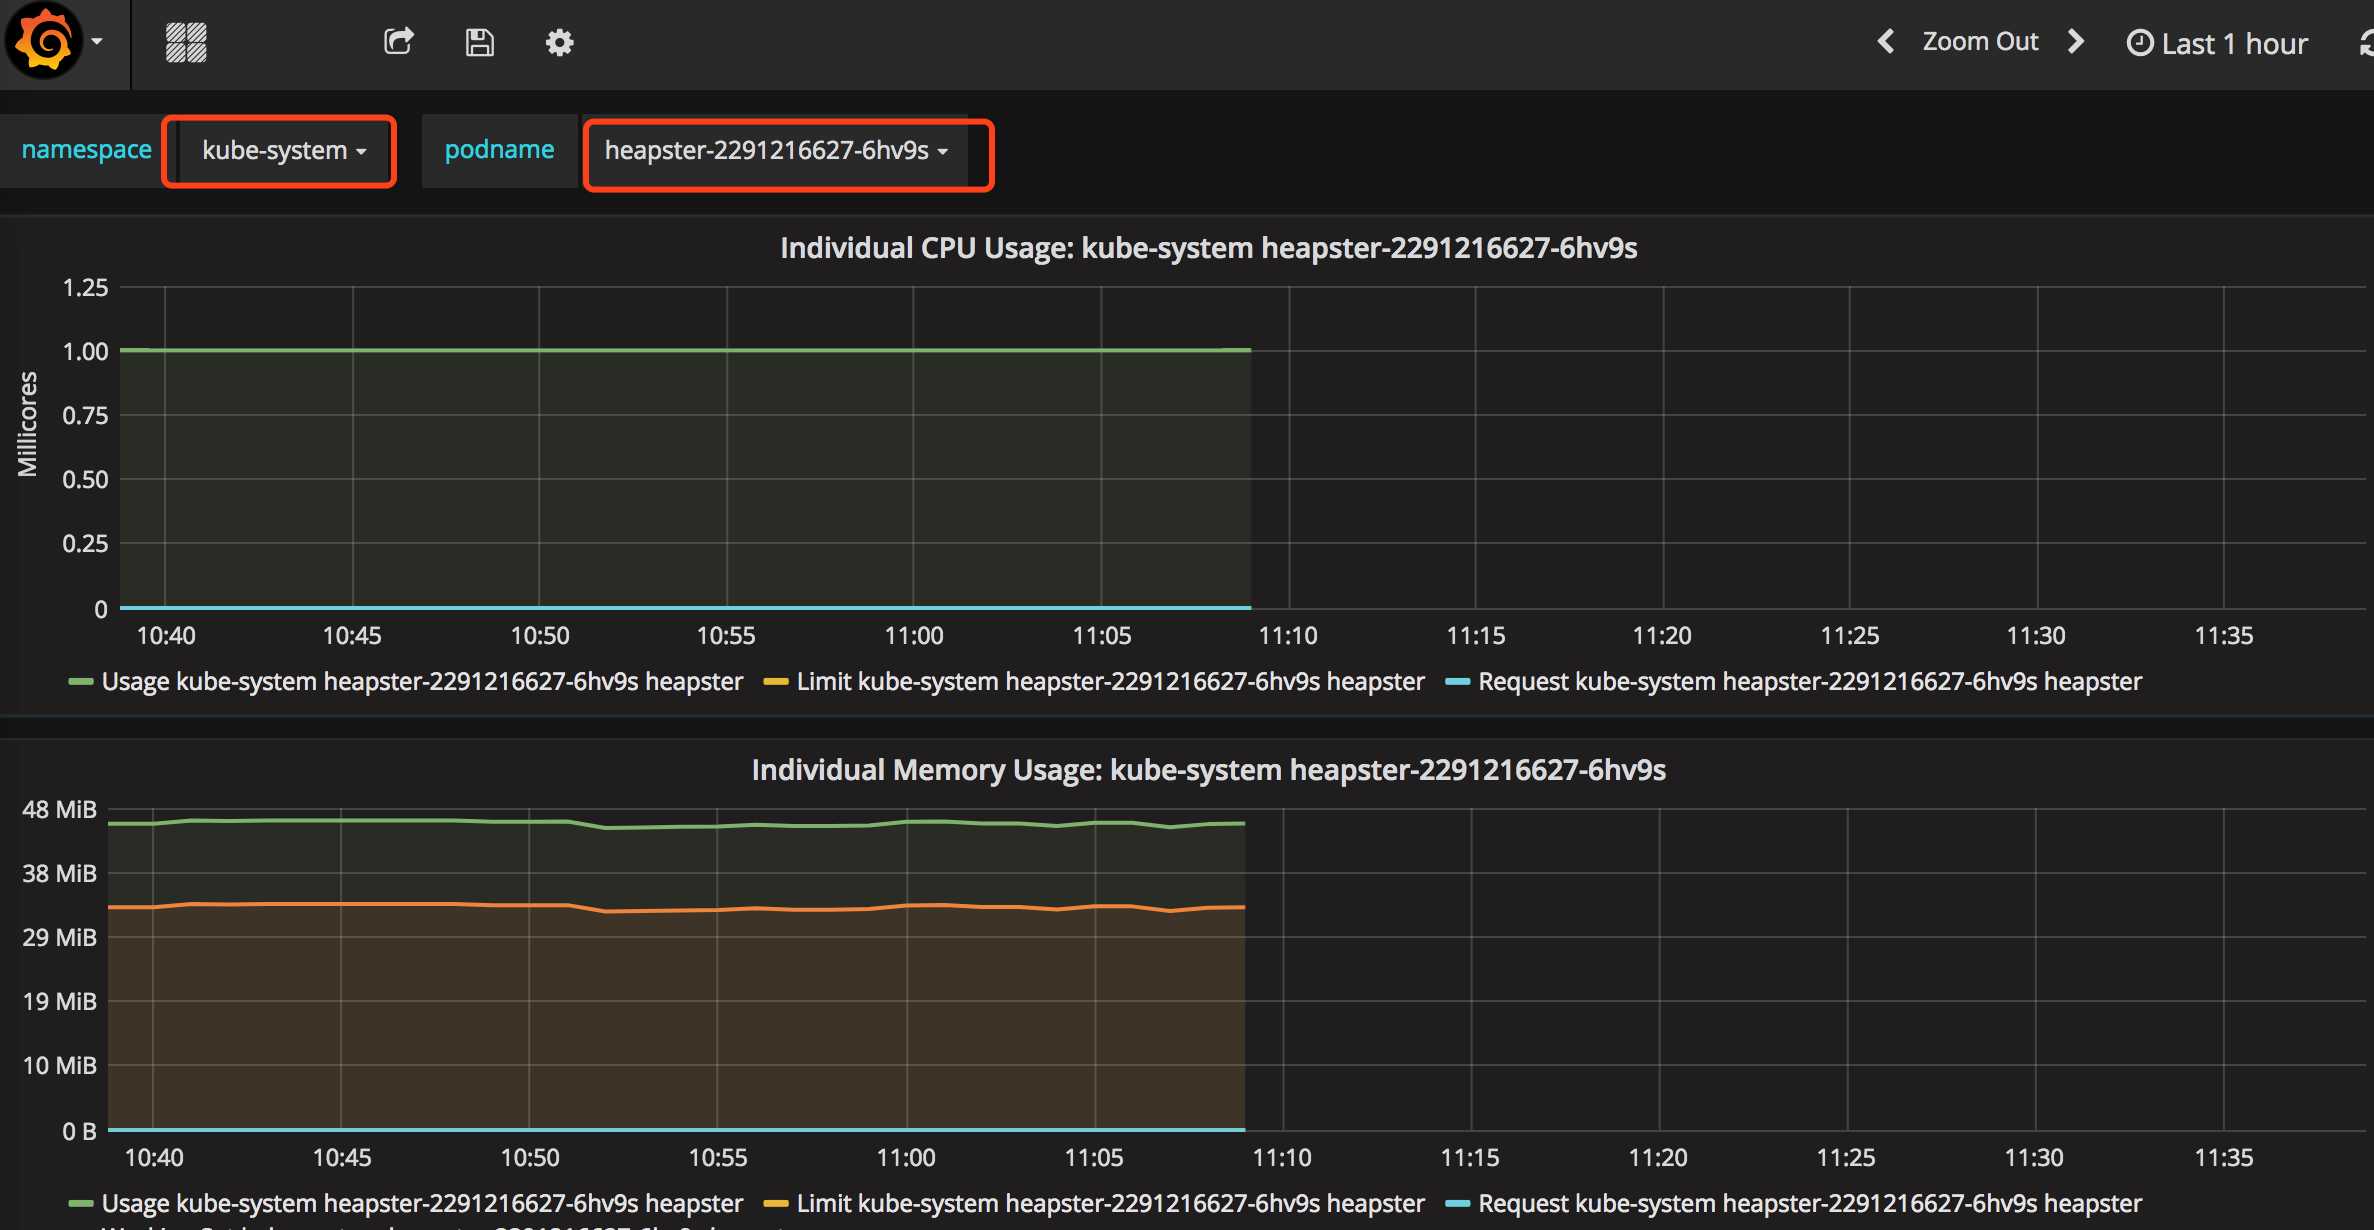
点击“Home”下拉列表,选择Pods,如下图。图中展示了Pod的信息,以折线图的形式展示了集群范围内各Pod的CPU使用率、内存使用情况、网络流量、文件系统使用情况等信息。
获取 influxdb http 8086 映射的 NodePort:
[root@node1 influxdb]# kubectl get svc -n kube-system|grep influxdb
monitoring-influxdb    10.254.66.133    <nodes>       8086:32570/TCP,8083:31601/TCP   17m
通过 kube-apiserver 的非安全端口访问 influxdb 的 admin UI 界面:http://172.16.7.151:8080/api/v1/proxy/namespaces/kube-system/services/monitoring-influxdb:8083/
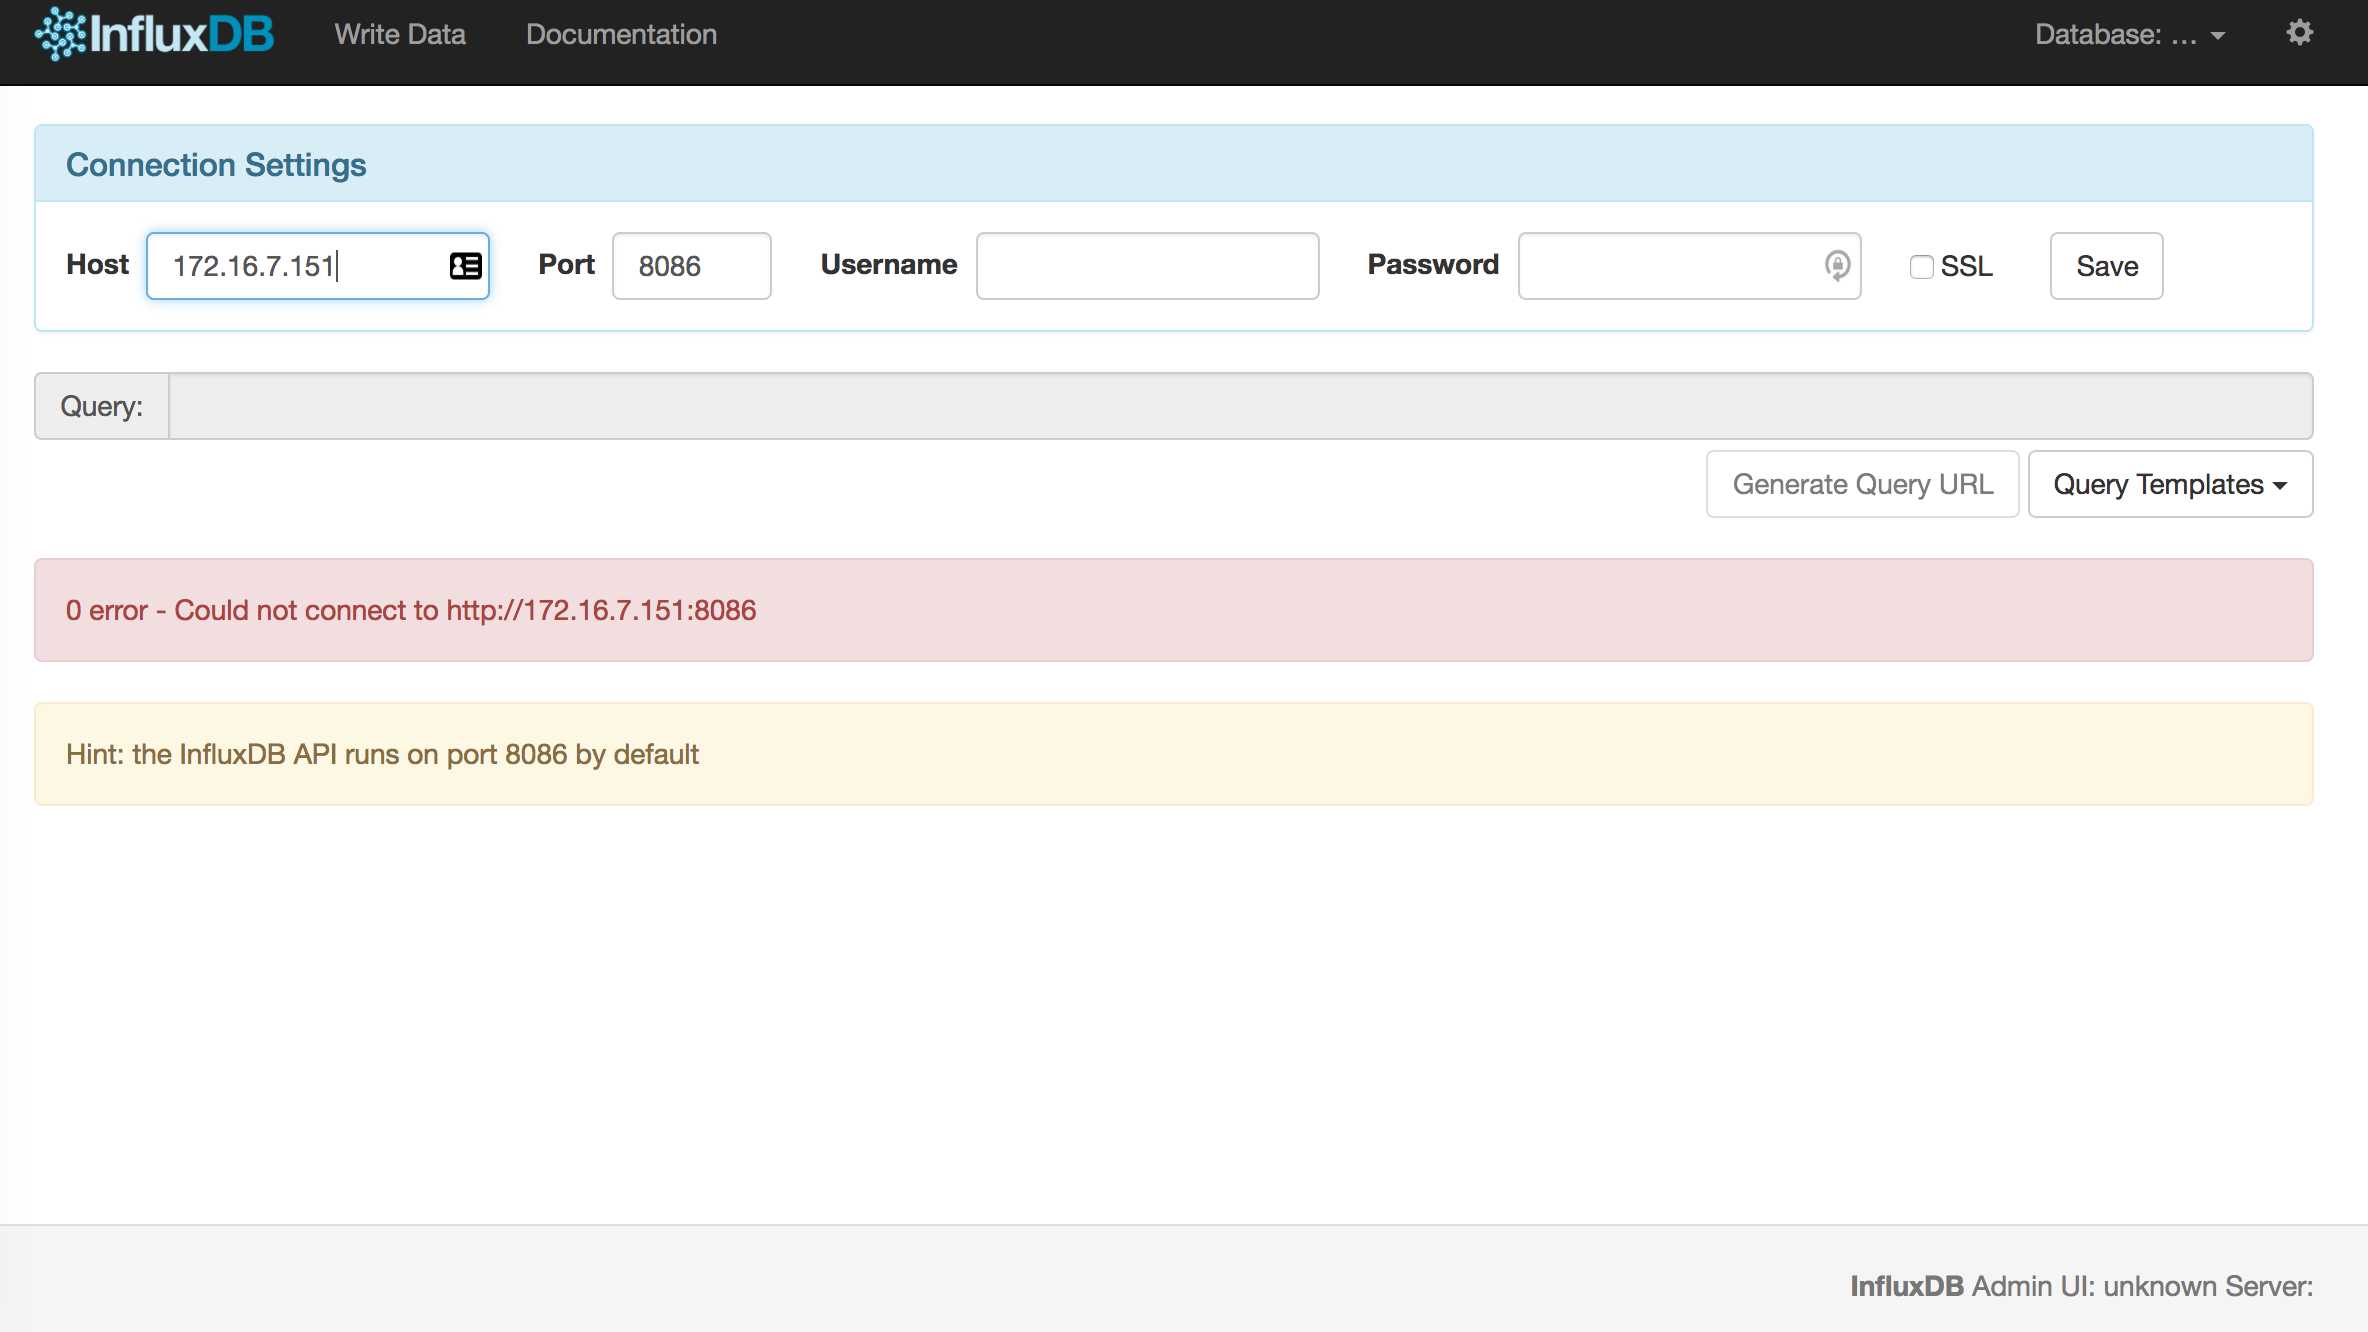
在页面的 “Connection Settings” 的 Host 中输入 node IP, Port 中输入 8086 映射的 nodePort 如上面的 32570,点击 “Save” 即可(我的集群中的地址是172.16.7.151:32570)。
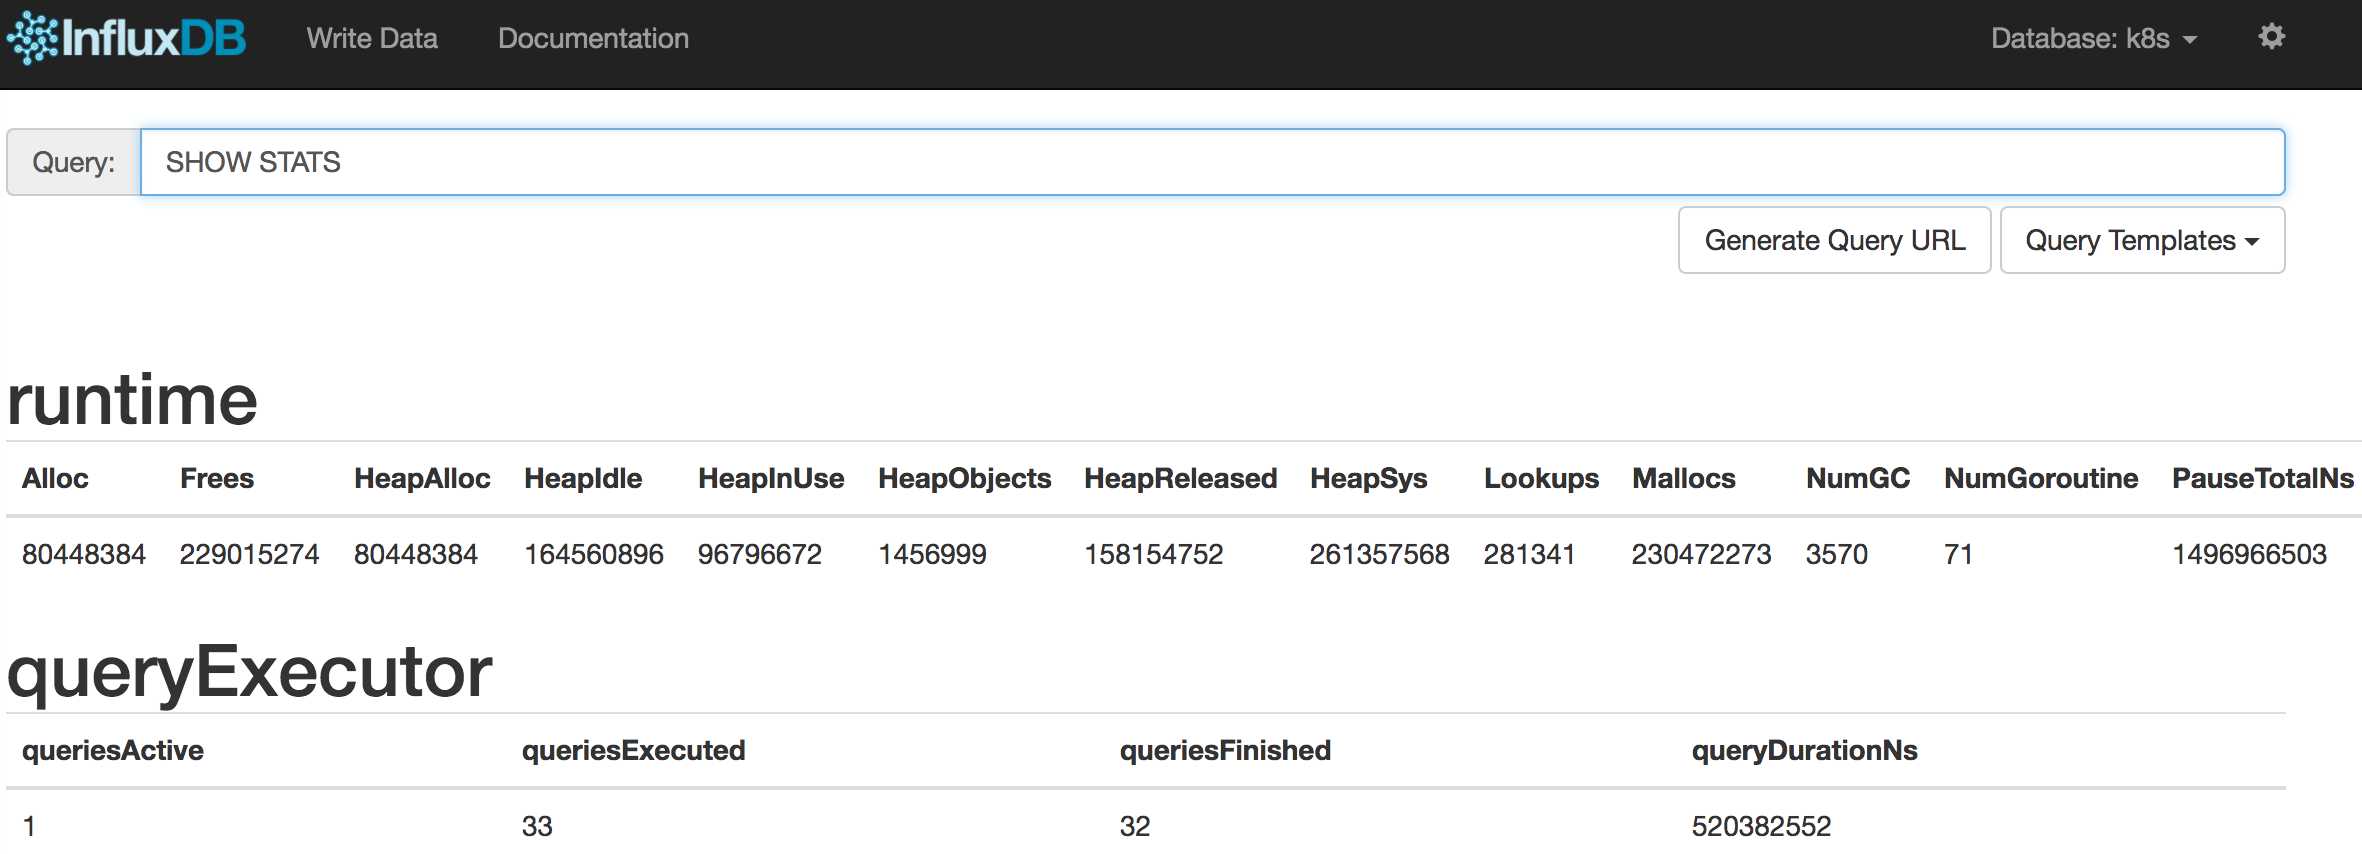
通过右上角齿轮按钮可以修改连接属性。单击右上角的Database下拉列表可以选择数据库,heapster创建的数据库名为k8s。
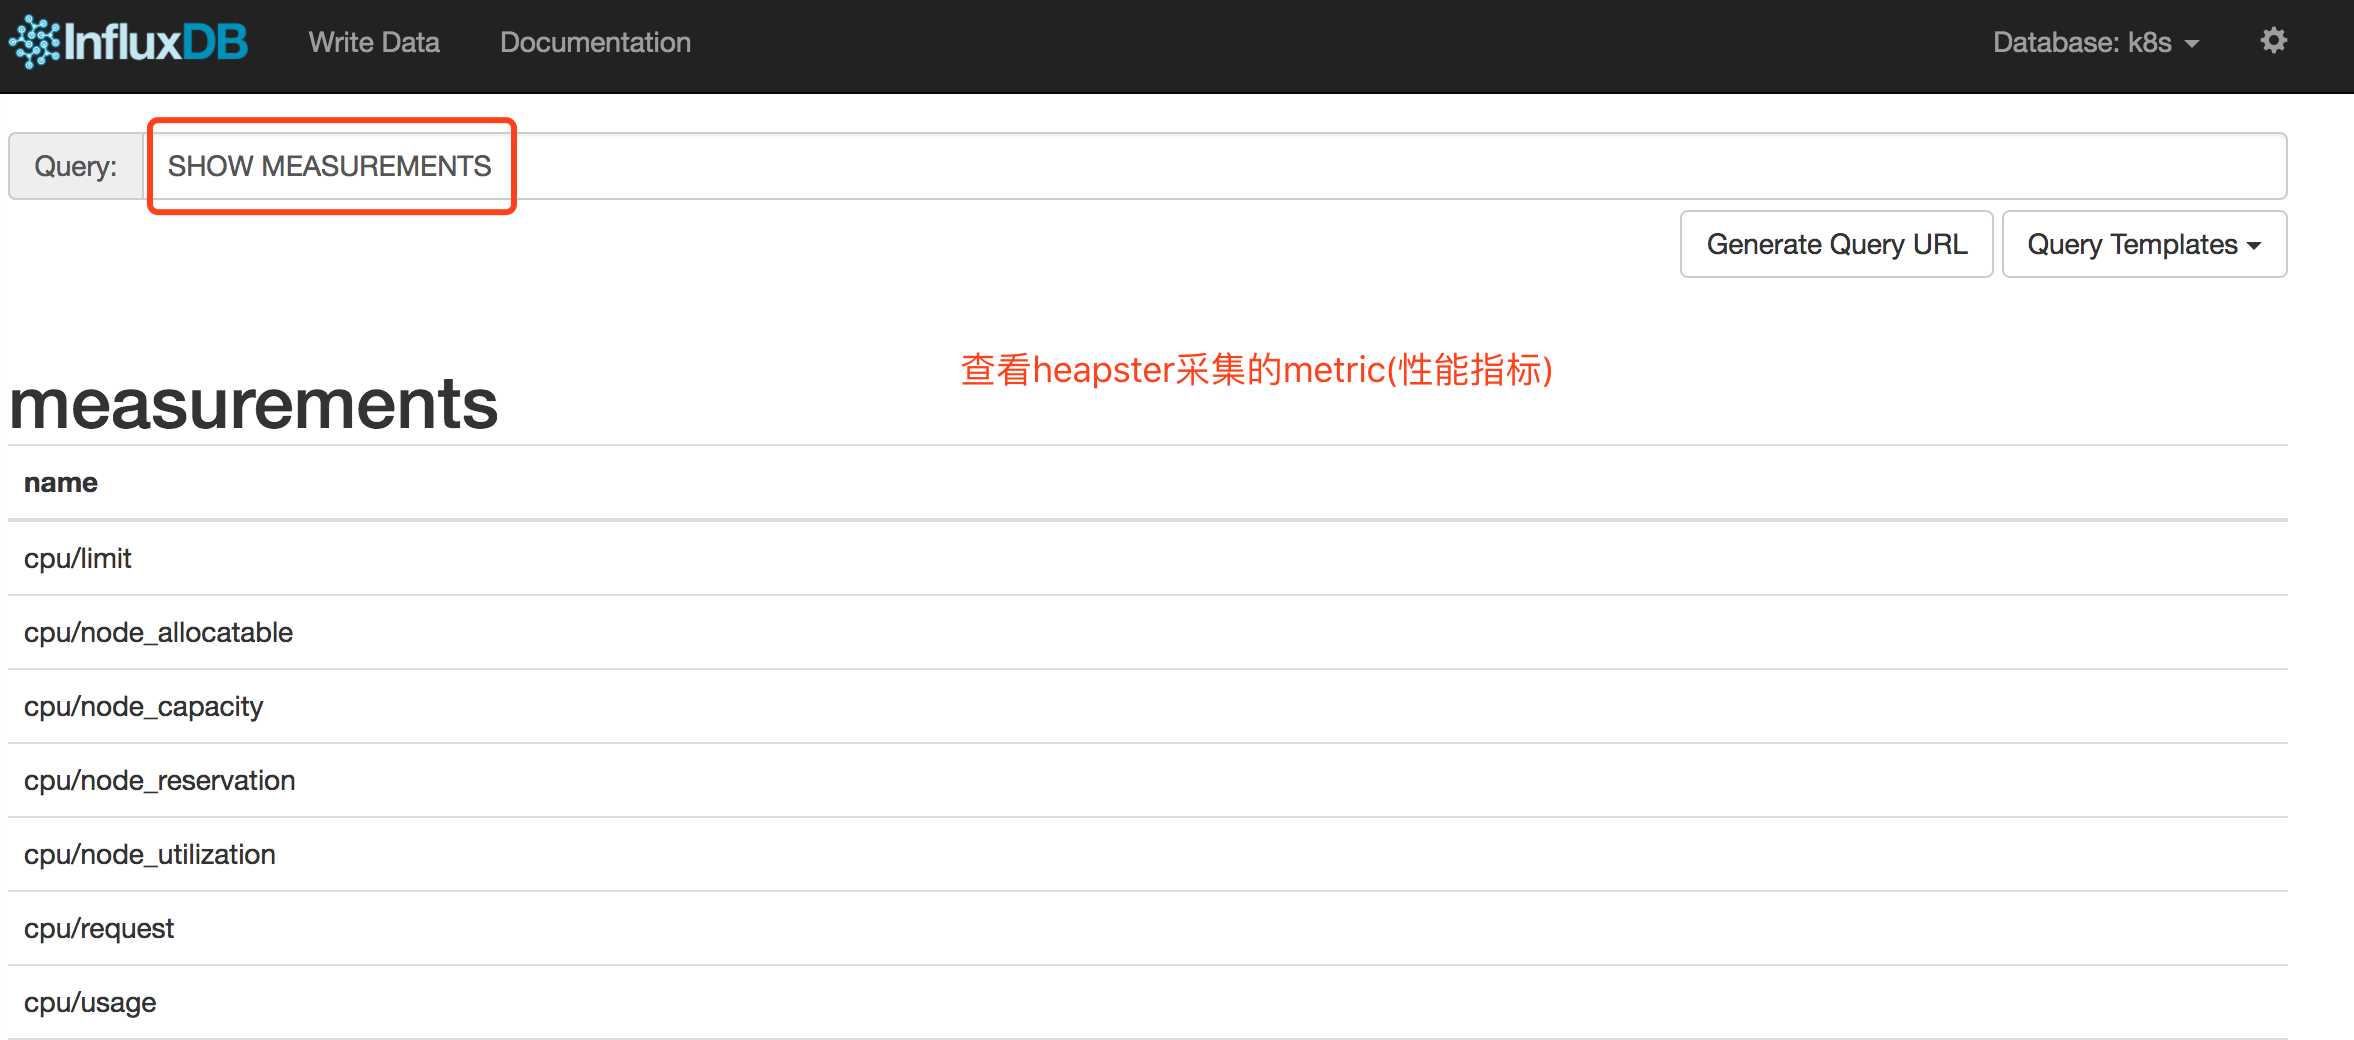
| metric名称 | 说明 |
| cpu/limit | CPU hard limit,单位为毫秒 |
| cpu/usage | 全部Core的CPU累计使用时间 |
| cpu/usage_rate | 全部Core的CPU累计使用率,单位为毫秒 |
| filesystem/limit | 文件系统总空间限制,单位为字节 |
| filesystem/usage | 文件系统已用的空间,单位为字节 |
| memory/limit | Memory hard limit,单位为字节 |
| memory/major_page_faults | major page faults数量 |
| memory/major_page_faults_rate | 每秒的major page faults数量 |
| memory/node_allocatable | Node可分配的内存容量 |
| memory/node_capacity | Node的内存容量 |
| memory/node_reservation | Node保留的内存share |
| memory/node_utilization | Node的内存使用值 |
| memory/page_faults | page faults数量 |
| memory/page_faults_rate | 每秒的page faults数量 |
| memory/request | Memory request,单位为字节 |
| memory/usage | 总内存使用量 |
| memory/working_set | 总的Working set usage,Working set是指不会被kernel移除的内存 |
| network/rx | 累计接收的网络流量字节数 |
| network/rx_errors | 累计接收的网络流量错误数 |
| network/rx_errors_rate | 每秒接收的网络流量错误数 |
| network/rx_rate | 每秒接收的网络流量字节数 |
| network/tx | 累计发送的网络流量字节数 |
| network/tx_errors | 累计发送的网络流量错误数 |
| network/tx_errors_rate | 每秒发送的网络流量错误数 |
| network/tx_rate | 每秒发送的网络流量字节数 |
| uptime | 容器启动总时长 |
每个metric可以看作一张数据库表,表中每条记录由一组label组成,可以看成字段。如下表所示:
| Label名称 | 说明 |
| pod_id | 系统生成的Pod唯一名称 |
| pod_name | 用户指定的Pod名称 |
| pod_namespace | Pod所属的namespace |
| container_base_image | 容器的镜像名称 |
| container_name | 用户指定的容器名称 |
| host_id | 用户指定的Node主机名 |
| hostname | 容器运行所在主机名 |
| labels | 逗号分隔的Label列表 |
| namespace_id | Pod所属的namespace的UID |
| resource_id | 资源ID |
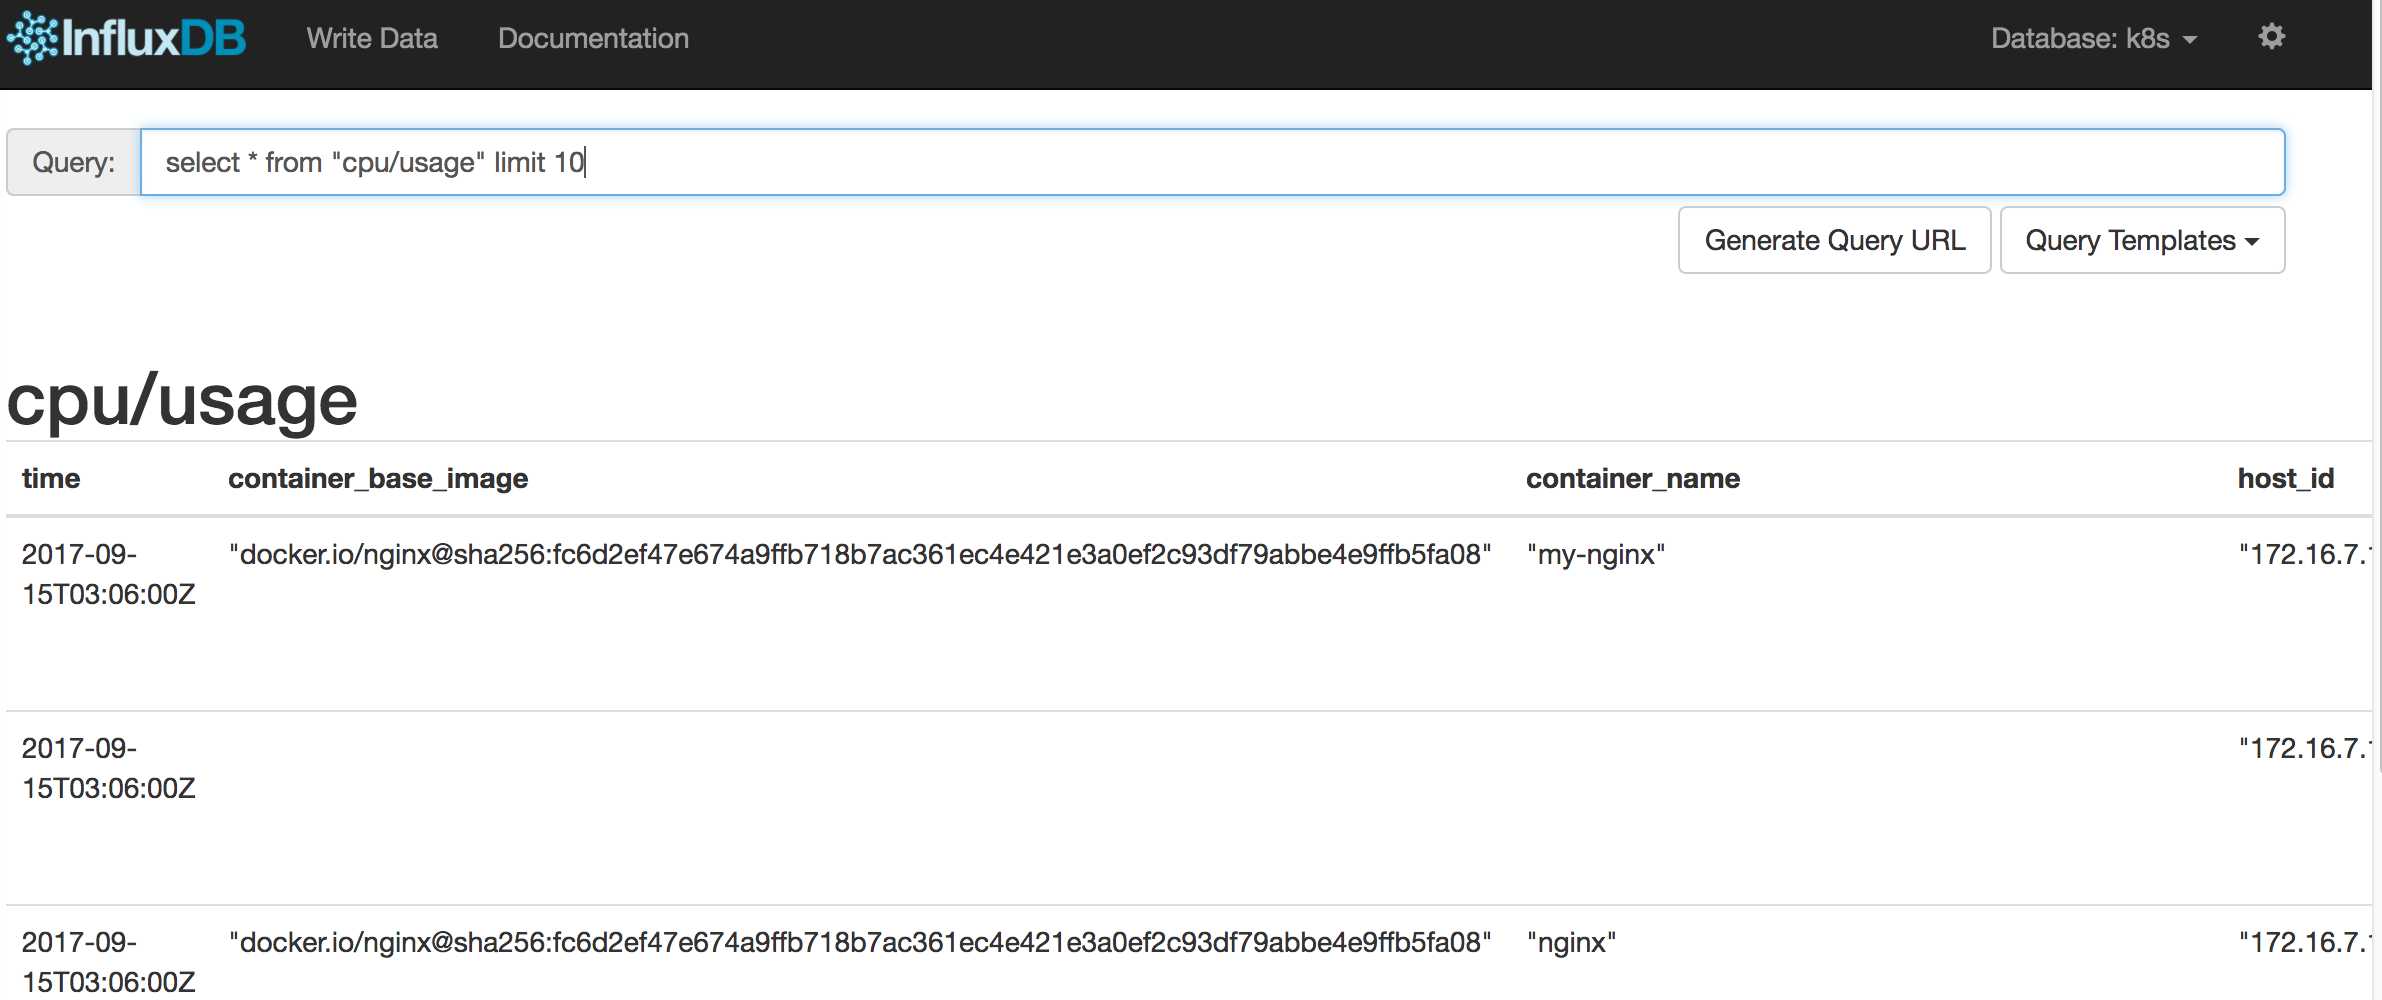
可以使用SQL SELECT语句对每个metric进行查询,例如查询CPU的使用时间:
select * from "cpu/usage" limit 10
结果如下图所示:
Kubernetes监控:部署Heapster、InfluxDB和Grafana
标签:dashboard monitor uid logs 之一 and setting hive http
原文地址:http://www.cnblogs.com/zhaojiankai/p/7890991.html
