目的:
1.根据模板里面的excel数据信息,动态创建line chart
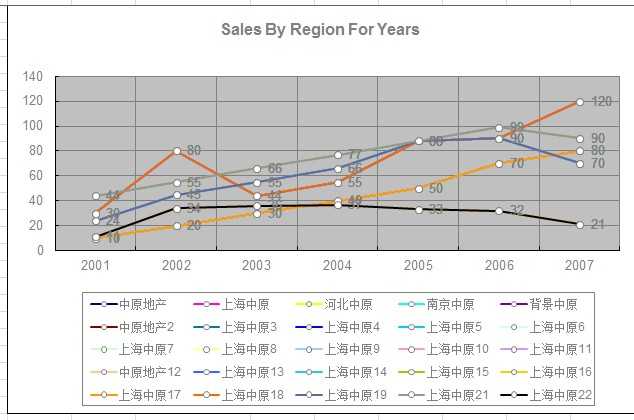
2.linechart 的样式改为灰色
3.以流的形式写到客户端,不管客户端是否装excel,都可以导出到到客户端
4.使用Aspose.Cells的基本功能
5.使用mvc测试代码
导出到excel里面的效果图
excel里面的数据源sheet2
|
1
2
3
4
5
6
7
8
9
10
11
12
13
14
15
16
17
18
19
20
21
22
23
24
25
26
|
2001 2002 2003 2004 2005 2006 2007中原地产 10 20 30 40 50 70 80上海中原 30 80 44 55 88 90 120河北中原 24 45 55 66 88 90 70南京中原 44 55 66 77 88 99 90背景中原 11 34 36 37 33 32 21中原地产2 10 20 30 40 50 70 80上海中原3 30 80 44 55 88 90 120上海中原4 24 45 55 66 88 90 70上海中原5 44 55 66 77 88 99 90上海中原6 11 34 36 37 33 32 21上海中原7 10 20 30 40 50 70 80上海中原8 30 80 44 55 88 90 120上海中原9 24 45 55 66 88 90 70上海中原10 44 55 66 77 88 99 90上海中原11 11 34 36 37 33 32 21中原地产12 10 20 30 40 50 70 80上海中原13 30 80 44 55 88 90 120上海中原14 24 45 55 66 88 90 70上海中原15 44 55 66 77 88 99 90上海中原16 11 34 36 37 33 32 21上海中原17 10 20 30 40 50 70 80上海中原18 30 80 44 55 88 90 120上海中原19 24 45 55 66 88 90 70上海中原21 44 55 66 77 88 99 90上海中原22 11 34 36 37 33 32 21 |
入口方法:
|
1
2
3
4
5
6
7
8
9
10
11
12
13
14
15
16
17
18
|
public ActionResult excels(){WorkbookDesigner designer = new WorkbookDesigner();string path = Server.MapPath("/Templete/11111.xls");designer.Workbook.Open(path);Workbook workbook = designer.Workbook;//创建一个chart到页面CreateStaticReport1(workbook);designer.Process();//将流文件写到客户端流的形式写到客户端,名称是_report.xlsdesigner.Save("_report.xls", SaveType.OpenInExcel, FileFormatType.Excel2003, System.Web.HttpContext.Current.Response);Response.Flush();Response.Close();designer = null;// Response.End();return View("getexcel");} |
生成chart方法
|
1
2
3
4
5
6
7
8
9
10
11
12
13
14
15
16
17
18
19
20
21
22
23
24
25
26
27
28
29
30
31
32
33
34
35
36
37
38
39
40
41
42
43
44
45
46
47
48
49
50
51
52
53
54
55
56
57
58
59
60
61
62
63
64
65
|
private void CreateStaticReport1(Workbook workbook){ //创建一个折线图 workbook.Worksheets[0].Charts.Add(ChartType.Line, 1, 1, 25, 10); Aspose.Cells.Chart chart = workbook.Worksheets[0].Charts[0]; //折线区域竖线设置为显示颜色设置为灰色 chart.CategoryAxis.MajorGridLines.IsVisible = true; chart.CategoryAxis.MajorGridLines.Color = Color.Gray; //折线区域设置横着的网格线显示 chart.MajorGridLines.IsVisible = true; chart.MajorGridLines.Color = Color.Gray; //设置title样式 chart.Title.Text = "Sales By Region For Years"; chart.Title.TextFont.Color = Color.Gray; chart.Title.TextFont.IsBold = true; chart.Title.TextFont.Size = 12; //Set Properties of nseries chart.NSeries.Add("Sheet2!B2:H26", false); //Set NSeries Category Datasource chart.NSeries.CategoryData = "Sheet2!B1:H1"; Cells cells = workbook.Worksheets[1].Cells; //loop over the Nseriese for (int i = 0; i < chart.NSeries.Count; i++) { //设置每条折线的名称 chart.NSeries[i].Name = cells[i + 1, 0].Value.ToString(); //设置线的宽度 chart.NSeries[i].Line.Weight = WeightType.MediumLine; //设置每个值坐标点的样式 chart.NSeries[i].MarkerStyle = ChartMarkerType.Circle; chart.NSeries[i].MarkerSize = 5; chart.NSeries[i].MarkerBackgroundColor = Color.White; chart.NSeries[i].MarkerForegroundColor = Color.Gray; //每个折线向显示出值 chart.NSeries[i].DataLabels.IsValueShown = true; chart.NSeries[i].DataLabels.TextFont.Color = Color.Gray; } //设置x轴上数据的样式为灰色 chart.CategoryAxis.TickLabels.Font.Color = Color.Gray; chart.CategoryAxis.TickLabelPosition = TickLabelPositionType.NextToAxis; //设置y轴的样式 chart.ValueAxis.TickLabelPosition = TickLabelPositionType.Low; chart.ValueAxis.TickLabels.Font.Color = Color.Gray; // chart.ValueAxis.TickLabels.TextDirection = TextDirectionType.LeftToRight; //设置Legend位置以及样式 chart.Legend.Position = LegendPositionType.Bottom; chart.Legend.TextFont.Color = Color.Gray; chart.Legend.Border.Color = Color.Gray;} |
目的:设置chart的y坐标轴显示值
用aspose.cell生成的chart生成的Y轴是默认生成的,自己要定义y轴坐标值
1.把数据源写到excel里面,list里面
2.y轴坐标自己定义
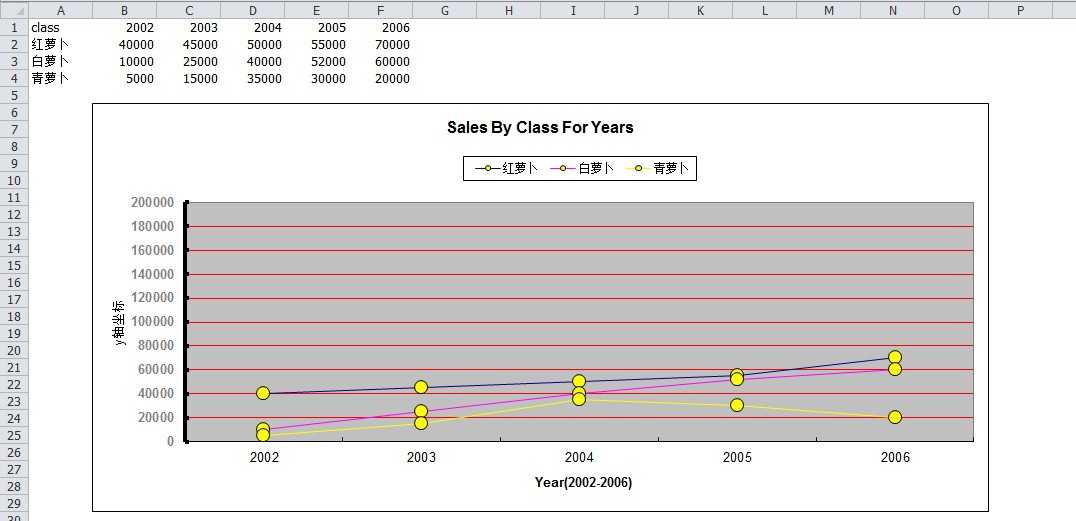
第一种:默认设置:chart里面会自己定义y轴坐标
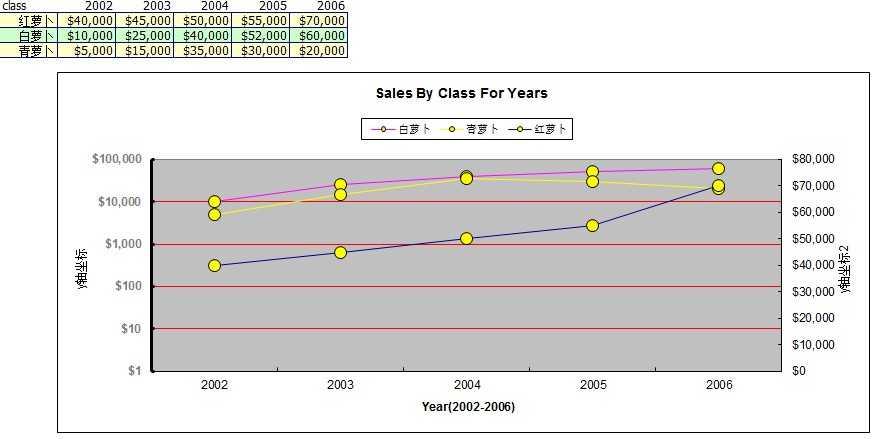
第二种:y周坐标以对数显示 chart.ValueAxis.IsLogarithmic = true; 以10 100 1000格式显示
第三种:只设置间隔值 chart.ValueAxis.MajorUnit =20000;,会自动获取y轴的最大值与最小值
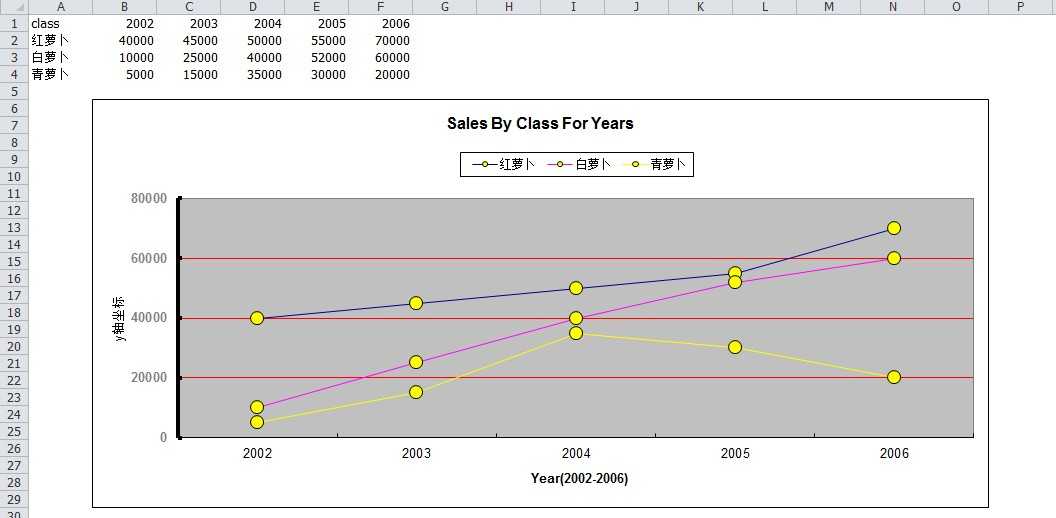
第四种:设置y轴的最大值与最小值,设置间隔值
//设置y坐标轴的厚度
chart.ValueAxis.AxisLine.Weight = WeightType.WideLine;
chart.ValueAxis.Title.Text = "y轴坐标";
chart.ValueAxis.MajorUnit =20000;//设置y轴的显示值间隔
chart.ValueAxis.MaxValue = 200000;//设置y轴开始最大值
chart.ValueAxis.MinValue = 0;//设置y轴的最小值
3.设置右边坐标轴是不是显示
//设置右边坐标轴显示
chart.SecondValueAxis.IsVisible = true;
//设置y坐标轴间隔值字大小
chart.SecondValueAxis.TickLabels.Font.Size = 12;
chart.SecondValueAxis.Title.Text = "y轴坐标2";
导出效果:
//设置y坐标轴的厚度
chart.ValueAxis.AxisLine.Weight = WeightType.WideLine;
chart.ValueAxis.Title.Text = "y轴坐标";
chart.ValueAxis.MajorUnit =20000;//设置y轴的显示值间隔
chart.ValueAxis.MaxValue = 200000;//设置y轴开始最大值
chart.ValueAxis.MinValue = 0;//设置y轴的最小值
第二种:y周坐标以对数显示 chart.ValueAxis.IsLogarithmic = true; 以10 100 1000格式显示
//设置y坐标轴的厚度
chart.ValueAxis.AxisLine.Weight = WeightType.WideLine;
chart.ValueAxis.Title.Text = "y轴坐标";
chart.ValueAxis.MajorUnit =20000;//设置y轴的显示值间隔
chart.ValueAxis.MaxValue = 80000;//设置y轴开始最大值
chart.ValueAxis.MinValue = 0;//设置y轴的最小值
入口函数
|
1
2
3
4
5
6
7
8
9
10
11
12
13
14
15
16
17
|
public ActionResult excels() { WorkbookDesigner designer = new WorkbookDesigner(); string path = Server.MapPath("/Templete/11111.xls"); designer.Workbook.Open(path); Workbook workbook = designer.Workbook; CreateStaticData(workbook); CreateStaticReport(workbook); designer.Process(); //将流文件写到客户端流的形式写到客户端,名称是_report.xls designer.Save("_report.xls", SaveType.OpenInExcel, FileFormatType.Excel2003, System.Web.HttpContext.Current.Response); Response.Flush(); Response.Close(); designer = null; // Response.End(); return View("getexcel"); } |
设置数据源
|
1
2
3
4
5
6
7
8
9
10
11
12
13
14
15
16
17
18
19
20
21
22
23
24
25
26
27
28
29
30
31
32
33
34
35
36
37
38
39
|
private void CreateStaticData(Workbook workbook) { //Initialize Cells object Cells cells = workbook.Worksheets[0].Cells; //Put string into a cells of Column A cells["A1"].PutValue("class"); cells["A2"].PutValue("红萝卜"); cells["A3"].PutValue("白萝卜"); cells["A4"].PutValue("青萝卜"); //Put a value into a Row 1 cells["B1"].PutValue(2002); cells["C1"].PutValue(2003); cells["D1"].PutValue(2004); cells["E1"].PutValue(2005); cells["F1"].PutValue(2006); //Put a value into a Row 2 cells["B2"].PutValue(40000); cells["C2"].PutValue(45000); cells["D2"].PutValue(50000); cells["E2"].PutValue(55000); cells["F2"].PutValue(70000); //Put a value into a Row 3 cells["B3"].PutValue(10000); cells["C3"].PutValue(25000); cells["D3"].PutValue(40000); cells["E3"].PutValue(52000); cells["F3"].PutValue(60000); //Put a value into a Row 4 cells["B4"].PutValue(5000); cells["C4"].PutValue(15000); cells["D4"].PutValue(35000); cells["E4"].PutValue(30000); cells["F4"].PutValue(20000); } |
设置chart y轴的显示值
|
1
2
3
4
5
6
7
8
9
10
11
12
13
14
15
16
17
18
19
20
21
22
23
24
25
26
27
28
29
30
31
32
33
34
35
36
37
38
39
40
41
42
43
44
45
46
47
48
49
50
51
52
53
54
55
56
57
58
59
60
61
62
63
64
65
66
67
68
69
70
|
private void CreateStaticReport(Workbook workbook) { //初始化 Worksheet Worksheet sheet = workbook.Worksheets[0]; //设置 worksheet名称 sheet.Name = "Line"; //设置worksheet不显示 sheet.IsGridlinesVisible = false; //根据数据源 创建 chart int chartIndex = 0; chartIndex = sheet.Charts.Add(ChartType.Line, 5, 1, 29, 15); //初始化chart Chart chart = sheet.Charts[chartIndex]; //设置竖线不显示 chart.CategoryAxis.MajorGridLines.IsVisible = false; //设置Title样式 chart.Title.Text = "Sales By Class For Years"; chart.Title.TextFont.Color = Color.Black; chart.Title.TextFont.IsBold = true; chart.Title.TextFont.Size = 12; //设置chart的数据源 chart.NSeries.Add("B2:F4", false); chart.NSeries.CategoryData = "B1:F1"; //Set Nseries color varience to True chart.NSeries.IsColorVaried = true; //初始化 Cells Cells cells = workbook.Worksheets[0].Cells; //循环 cells for (int i = 0; i < chart.NSeries.Count; i++) { //设置系列的名称 chart.NSeries[i].Name = cells[i + 1, 0].Value.ToString(); chart.NSeries[i].MarkerStyle = ChartMarkerType.Circle; //设置系列的名称 Background 与ForeGround chart.NSeries[i].MarkerBackgroundColor = Color.Yellow; chart.NSeries[i].MarkerForegroundColor = Color.Gold; //设置系列标记 chart.NSeries[i].MarkerSize = 10; //设置Category的名称 chart.CategoryAxis.Title.Text = "Year(2002-2006)"; chart.CategoryAxis.Title.TextFont.Color = Color.Black; chart.CategoryAxis.Title.TextFont.IsBold = true; chart.CategoryAxis.Title.TextFont.Size = 10; //设置图例的位置 chart.Legend.Position = LegendPositionType.Top; } //设置y轴的样式 chart.ValueAxis.TickLabelPosition = TickLabelPositionType.NextToAxis; chart.ValueAxis.TickLabels.Font.Color = Color.Gray; chart.ValueAxis.AxisBetweenCategories = false; //chart.ValueAxis.TickLabels.Font.Size = 13; chart.ValueAxis.TickLabels.Font.IsBold = true; //Y坐标轴对数间隔展示 // chart.ValueAxis.IsLogarithmic = true; chart.ValueAxis.MajorGridLines.Color = Color.Red; chart.ValueAxis.AxisLine.Color = Color.DarkGreen; //设置y坐标轴的厚度 chart.ValueAxis.AxisLine.Weight = WeightType.WideLine; chart.ValueAxis.Title.Text = "y轴坐标"; chart.ValueAxis.MajorUnit = 20000;//MajorUnit =2000; chart.ValueAxis.MaxValue = 200000; chart.ValueAxis.MinValue = 0; //设置右边坐标轴显示 chart.SecondValueAxis.IsVisible = true; //设置y坐标轴间隔值字大小 chart.SecondValueAxis.TickLabels.Font.Size = 12; chart.SecondValueAxis.Title.Text = "y轴坐标2"; // chart.SecondValueAxis.MinorGridLines.IsVisible = true; } |