引用Numpy
import numpy as np
生成随机数据
# 200支股票
stock_cnt = 200
# 504个交易日
view_days = 504
# 生成服从正态分布:均值期望=0,标准差=1的序列
stock_day_change = np.random.standard_normal((stock_cnt, view_days))
# 使用沙盒数据,目的是和书中一样的数据环境,不需要注视掉
# stock_day_change = np.load(‘../gen/stock_day_change.npy‘)
# 打印shape (200, 504) 200行504列
print(stock_day_change.shape)
# 打印出第一支只股票,头五个交易日的涨跌幅情况
print(stock_day_change[0:1, :5])
3.1.3 索引选取和切片选择
# 0:2第一,第二支股票,0:5头五个交易日的涨跌幅数据
stock_day_change[0:2, 0:5]
3.1.4 数据转换与规整
# 2代表保留两位小数
np.around(stock_day_change[0:2, 0:5], 2)
3.1.5 逻辑条件进行数据筛选
mask = stock_day_change[0:2, 0:5] > 0.5
print(mask)
3.1.6 通用序列函数
# np.all判断序列中的所有元素是否全部是true, 即对bool序列进行与操作
# 本例实际判断stock_day_change[0:2, 0:5]中是否全是上涨的
np.all(stock_day_change[0:2, 0:5] > 0)
# np.any判断序列中是否有元素为true, 即对bool序列进行或操作
# 本例实际判断stock_day_change[0:2, 0:5]中是至少有一个是上涨的
np.any(stock_day_change[0:2, 0:5] > 0)
# 对两个序列对应的元素两两比较,maximum结果集取大,相对使用minimum为取小的结果集
np.maximum(stock_day_change[0:2, 0:5], stock_day_change[-2:, -5:])
# array([[ 0.38035486,  0.12259674, -0.2851901 , -0.00889681,  0.45731945],
       # [ 0.13380956,  2.03488293,  1.44701057, -0.92392477,  0.96930104]])
change_int = stock_day_change[0:2, 0:5].astype(int)
print(change_int)
# 序列中数值值唯一且不重复的值组成新的序列
np.unique(change_int)
# diff 前后临近数据进行减法运算
# axis=1
np.diff(stock_day_change[0:2, 0:5])
# 唯一区别 axis=0
np.diff(stock_day_change[0:2, 0:5], axis=0)
#where 数据筛选
tmp_test = stock_day_change[-2:, -5:]
print(np.where(tmp_test > 0.5, 1, 0))
统计概念与函数使用
stock_day_change_four = stock_day_change[:4, :4]
print(‘最大涨幅 {}‘.format(np.max(stock_day_change_four, axis=1)))
print(‘最大跌幅 {}‘.format(np.min(stock_day_change_four, axis=1)))
print(‘振幅幅度 {}‘.format(np.std(stock_day_change_four, axis=1)))
print(‘平均涨跌 {}‘.format(np.mean(stock_day_change_four, axis=1)))
3.2.2 统计基础概念
a_investor = np.random.normal(loc=100, scale=50, size=(100, 1))
b_investor = np.random.normal(loc=100, scale=20, size=(100, 1))

# a交易者
print(‘交易者期望{0:.2f}元, 标准差{1:.2f}, 方差{2:.2f}‘.format(a_investor.mean(), a_investor.std(), a_investor.var()))
# b交易者
print(‘交易者期望{0:.2f}元, 标准差{1:.2f}, 方差{2:.2f}‘.format(b_investor.mean(), b_investor.std(), b_investor.var()))
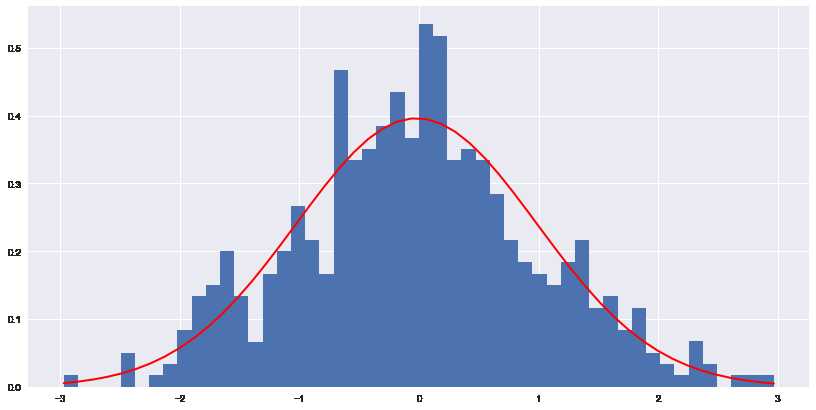
正态分布
import scipy.stats as scs

# 均值期望
stock_mean = stock_day_change[0].mean()
# 标准差
stock_std = stock_day_change[0].std()
print(‘股票0 mean均值期望:{:.3f}‘.format(stock_mean))
print(‘股票0 std振幅标准差:{:.3f}‘.format(stock_std))

# 绘制股票0的直方图
plt.hist(stock_day_change[0], bins=50, normed=True)

# linspace从股票0 最小值-> 最大值生成数据
fit_linspace = np.linspace(stock_day_change[0].min(),
                           stock_day_change[0].max())

# 概率密度函数(PDF,probability density function)
# 由均值,方差,来描述曲线,使用scipy.stats.norm.pdf生成拟合曲线
pdf = scs.norm(stock_mean, stock_std).pdf(fit_linspace)
# plot x, y
plt.plot(fit_linspace, pdf, lw=2, c=‘r‘)
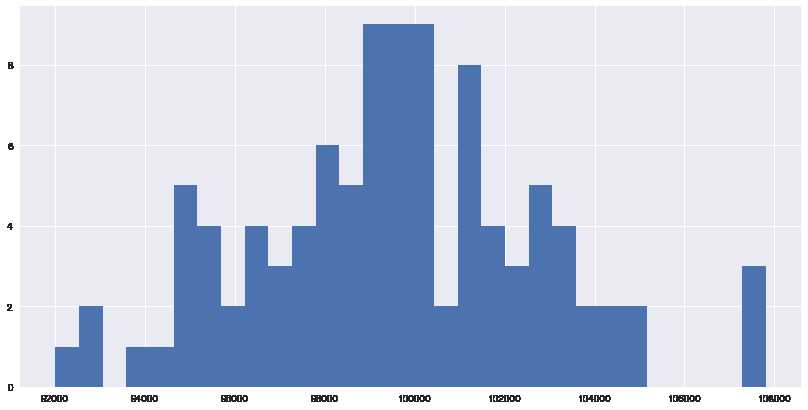
# 100个赌徒进场开始,胜率0.45,赔率1.04,手续费0.01
moneys = [casino(0.45, commission=0.01, win_once=1.02, loss_once=0.98)
          for _ in np.arange(0, gamblers)]
_ = plt.hist(moneys, bins=30)
伯努利分布