标签:string date child name secondary dex lda ogr database
https://support.citrix.com/article/CTX227727
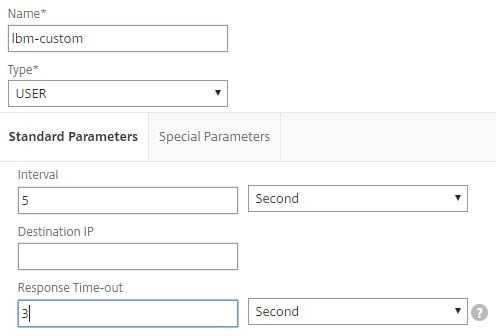
This article describes how to create a Perl based Custom Monitor on NetScaler.
The NetScaler appliance has a lot of different monitors inbuilt, but there are use cases these monitors do not cover. For this NetScaler supports monitors of type USER, which brings the possibility to run external Perl scripts to track the health of a custom application or server. This article shows the steps you need to do before successfully running a custom monitor.
For an overview about Custom User Monitors refer to Citrix Documentation - https://docs.citrix.com/ko-kr/netscaler/11-1/load-balancing/load-balancing-custom-monitors/understand-user-monitors.html
We also need a sub doing the data processing with a response code of 0 (probe successful) or 1 (probe failed). Finally we need to register the sub to KAS.
#!/usr/bin/perl -w
################################################################
##
################################################################

use Netscaler::KAS;
use strict;

sub soap_probe {
 ## init variable with argument
 my $searchString = $ARGV[0];

 ## send request and collect response here
 my $response = "value";

 ## check response
 if (index($response, $searchString) != -1) {
  return(0);
 } else {
  return (1,"String not found");
 }

## register prob sub to the KAS module
probe(\&soap_probe);
To debug the script, you must run it by using the nsumon-debug.pl script, located in /netscaler/monitors/.
To the run this debug script you must enter the following arguments:
nsumon-debug.pl <scriptname> <IP> <port> <timeout> <partitionID> [scriptarguments] [is_secure]
Another possibility is to run the script with the Perl interpreter to check any errors:
root@cns1# perl custom-probe.pl test
1,String not found
This example shows a failed probe because the search string was not found in the response.
===============================
https://docs.citrix.com/ko-kr/netscaler/11-1/load-balancing/load-balancing-custom-monitors/understand-user-monitors.html
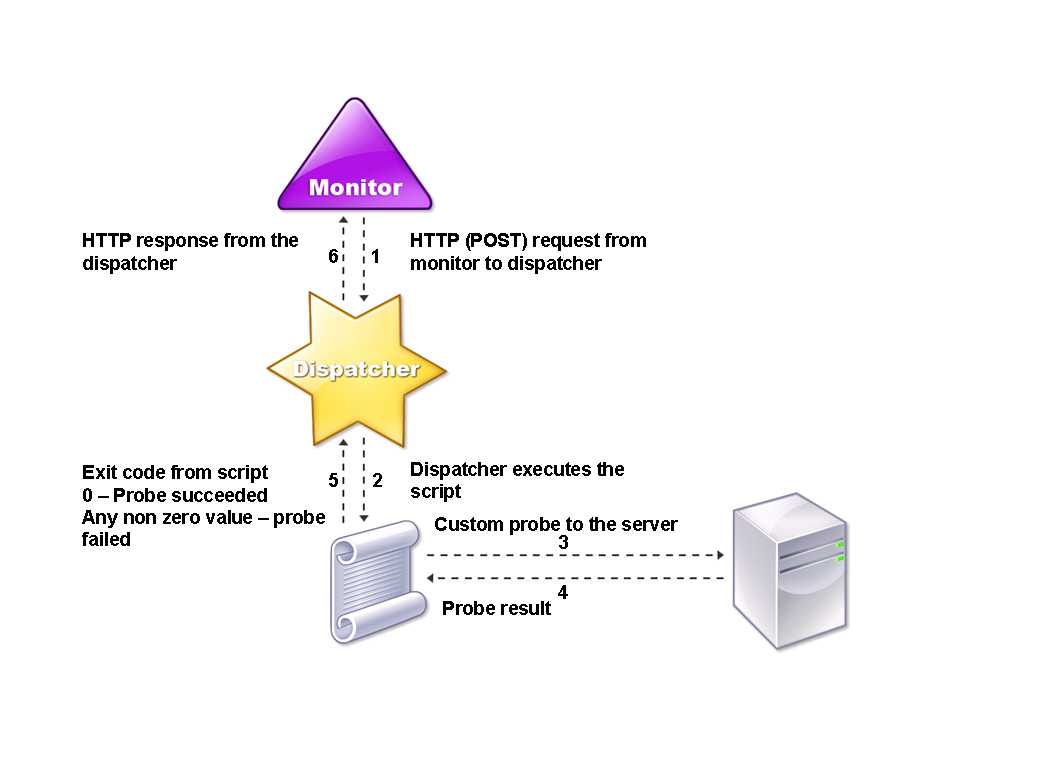
User monitors extend the scope of custom monitors. You can create user monitors to track the health of customized applications and protocols that the NetScaler appliance does not support. The following diagram illustrates how a user monitor works.
A user monitor requires the following components.
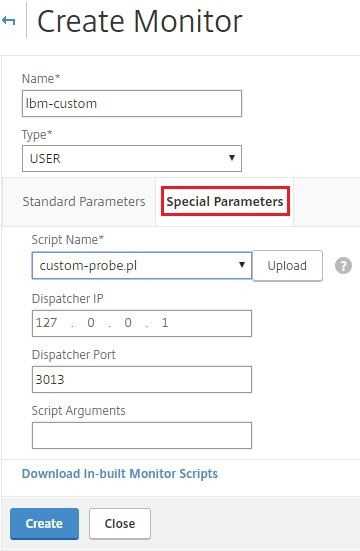
Dispatcher. A process, on the appliance, that listens to monitoring requests. A dispatcher can be on the loopback IP address (127.0.0.1) and port 3013. Dispatchers are also known as internal dispatchers. A dispatcher can also be a web server that supports Common Gateway Interface (CGI). Such dispatchers are also known as external dispatchers. They are used for custom scripts that do not run on the FreeBSD environment, such as .NET scripts.
In a HA setup, the dispatcher runs on both the primary and secondary NetScaler appliances. The dispatcher remains inactive on the secondary appliance.
Script. The script is a program that sends custom probes to the load balanced server and returns the response code to the dispatcher. The script can return any value to the dispatcher, but if a probe succeeds, the script must return a value of zero (0). The dispatcher considers any other value as probe failure.
For the scripts to function correctly, the name of the script file must not exceed 63 characters, and the maximum number of script arguments is 512. To debug the script, you must run it by using the nsumon-debug.pl script from the NetScaler command line. You use the script name (with its arguments), IP address, and the port as the arguments of the nsumon-debug.pl script. Users must use the script name, IP address, port, time-out, and the script arguments for the nsumon-debug.pl script.
nsldap.pl
nsnntp.pl
nspop3 nssf.pl
nssnmp.pl
nswi.pl
nstftp.pl
nssmtp.pl
nsrdp.pl
nsntlm-lwp.pl
nsftp.pl
nsappc.pl
USER
SMTP
NNTP
LDAP
SNMP
POP3
FTP_EXTENDED
STOREFRONT
APPC
CITRIX_WI_EXTENDED
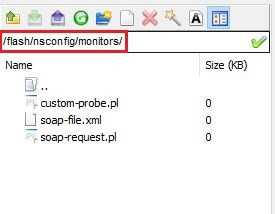
If you are creating a new custom script that uses one of these LB monitors types, make sure that you include IPv6 support in the custom script. Refer to the associated sample script in/netscaler/monitors/ for the changes that you have to make in the custom script for IPv6 support.
To track the status of the server, the monitor sends an HTTP POST request to the configured dispatcher. This POST request contains the IP address and port of the server, and the script that must be executed. The dispatcher executes the script as a child process, with user-defined parameters (if any). Then, the script sends a probe to the server. The script sends the status of the probe (response code) to the dispatcher. The dispatcher converts the response code to an HTTP response and sends it to the monitor. Based on the HTTP response, the monitor marks the service as up or down.
The appliance logs the error messages to the /var/nslog/nsumond.log file when user monitor probes fail. The following table lists the user monitors and the possible reasons for failure.
|
User monitor type |
Probe failure reasons |
|---|---|
|
SMTP |
Monitor fails to establish a connection to the server. |
|
NNTP |
Monitor fails to establish a connection to the server. |
|
Missing or invalid script arguments, which can include an invalid number of arguments or argument format. |
|
|
Monitor fails to find the NNTP group. |
|
|
LDAP |
Monitor fails to establish a connection to the server. |
|
Missing or invalid script arguments, which can include an invalid number of arguments or argument format. |
|
|
Monitor fails to bind to the LDAP server. |
|
|
Monitor fails to locate an entry for the target entity in the LDAP server. |
|
|
FTP |
The connection to the server times out. |
|
Missing or invalid script arguments, which can include an invalid number of arguments or argument format. |
|
|
Logon fails. |
|
|
Monitor fails to find the file on the server. |
|
|
POP3 |
Monitor fails to establish a connection to the database. |
|
Missing or invalid script arguments, which can include an invalid number of arguments or argument format. |
|
|
Logon fails. |
|
|
POP3 |
Monitor fails to establish a connection to the database. |
|
Missing or invalid script arguments, which can include an invalid number of arguments or argument format. |
|
|
Logon fails. |
|
|
Preparation of SQL query fails. |
|
|
Execution of SQL query fails. |
|
|
SNMP |
Monitor fails to establish a connection to the database. |
|
Missing or invalid script arguments, which can include an invalid number of arguments or argument format. |
|
|
Logon fails. |
|
|
Monitor fails to create the SNMP session. |
|
|
Monitor fails to find the object identifier. |
|
|
The monitor threshold value setting is greater than or equal to the actual threshold of the monitor. |
|
|
RDP (Windows Terminal Server) |
Missing or invalid script arguments, which can include an invalid number of arguments or argument format. |
|
Monitor fails to create a socket. |
|
|
Mismatch in versions. |
|
|
Monitor fails to confirm connection. |
You can view the log file from the NetScaler command line by using the following commands, which open a BSD shell, display the log file on the screen, and then close the BSD shell and return you to the NetScaler command prompt:
> shell
root@ns# cat /var/nslog/nsumond.log
root@ns# exit
>
User monitors also have a time-out value and a retry count for probe failures. You can use user monitors with non-user monitors. During high CPU utilization, a non-user monitor enables faster detection of a server failure.
===============================
How to Create a Perl Based Custom Monitor on NetScaler
标签:string date child name secondary dex lda ogr database
原文地址:https://www.cnblogs.com/lsgxeva/p/9279796.html