标签:os.path -o cas lines 命令 for 通过 失败 主机地址
我们首先要提取你服务器上有多少mysql实例提取方法如下:#!/usr/bin/env python
import os
import json
t=os.popen("""sudo netstat -nltp|grep -w "mysqld"|grep -w "LISTEN"|grep -v grep|grep -v ‘^$‘|awk -F: ‘{print $4}‘""")
s=os.popen("""sudo netstat -nltp|grep -w "mysqld"|grep -w "LISTEN"|grep -v grep|grep -v ‘^$‘|awk -F: ‘{print $2}‘|awk ‘{print $1}‘""")port_info = []
ports = []for port in t.readlines():
r = os.path.basename(port.strip())
if r:
port_info.append(r)for port in s.readlines():
r = os.path.basename(port.strip())
if r:
port_info.append(r)port_info = list(set(port_info))
for port in port_info:
ports += [{‘{#MYSQLPORT}‘:port}]
print(json.dumps({‘data‘:ports},sort_keys=True,indent=4,separators=(‘,‘,‘:‘)))
执行结果: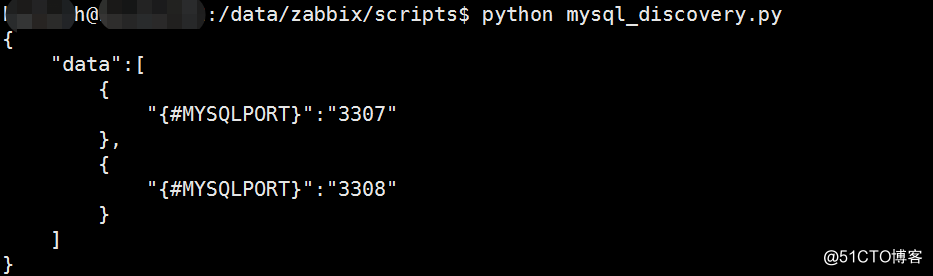
先看一下监控的第一个脚本和各个参数的含义如下:
#!/bin/bash
#-------------------------------------------------------------------------------
#FileName: check_mysql.sh
#-------------------------------------------------------------------------------#用户名
MYSQL_USER=‘zabbix‘#密码
MYSQL_PWD=‘zabbix‘#主机地址/IP
MYSQL_HOST=‘127.0.0.1‘#端口
MYSQL_PORT=$2#数据连接
MYSQL_CONN="/usr/bin/mysqladmin -u${MYSQL_USER} -p${MYSQL_PWD} -h${MYSQL_HOST} -P${MYSQL_PORT}"##help函数
help() {
echo "Usage:$0 [ping|Uptime|Com_update|Slow_queries|Com_select|Com_rollback|Questions|Com_insert|Com_delete|Com_commit|Bytes_sent|Bytes_received|Com_begin|Aborted_clients|Aborted_connects|Binlog_cache_disk_use|Binlog_cache_use|Uptime|Threads_running|Threads_connected|Threads_cached|Table_locks_immediate|Table_locks_waited|Slow_queries|Slave_running|Select_scan|Qcache_hits|Qcache_free_memory|Innodb_buffer_pool_pages_data|Innodb_buffer_pool_pages_dirty|Innodb_buffer_pool_pages_flushed|Innodb_buffer_pool_pages_free|Innodb_buffer_pool_pages_misc|Innodb_buffer_pool_pages_total|Innodb_buffer_pool_read_ahead_rnd|Innodb_buffer_pool_read_requests|Innodb_buffer_pool_reads|Innodb_buffer_pool_wait_free|Innodb_buffer_pool_write_requests|Innodb_data_fsyncs|Innodb_data_read|Innodb_data_reads|Innodb_data_writes|Innodb_data_written|Innodb_dblwr_pages_written|Innodb_dblwr_writes|Innodb_log_write_requests|Innodb_log_writes|Innodb_os_log_fsyncs|Innodb_os_log_written|Innodb_page_size|Innodb_pages_created|Innodb_pages_read|Innodb_pages_written|Innodb_rows_deleted|Innodb_rows_inserted|Innodb_rows_read|Innodb_rows_updated|Key_blocks_unused|Key_blocks_used|Key_read_requests|Key_reads|Open_tables|Opened_tables|Open_files|Qcache_free_memory|Qcache_lowmem_prunes|Queries|Select_full_join|Select_range|Select_range_check|Table_locks_immediate|Table_locks_waited|Table_open_cache_hits|Table_open_cache_misses] port"
}#参数是否正确
if [ $# -lt "2" ];then
echo "参数缺失!"
help
exit 2
fi#获取数据
case $1 in
ping)
result=${MYSQL_CONN} ping | grep -c alive
echo $result
;;
Uptime)
result=${MYSQL_CONN} status|cut -f2 -d":"|cut -f1 -d"T"
echo $result
;;
Com_update)
result=${MYSQL_CONN} extended-status |grep -w "Com_update"|cut -d"|" -f3
echo $result
;;
Slow_queries)
result=${MYSQL_CONN} status |cut -f5 -d":"|cut -f1 -d"O"
echo $result
;;
Com_select)
result=${MYSQL_CONN} extended-status |grep -w "Com_select"|cut -d"|" -f3
echo $result
;;
Com_rollback)
result=${MYSQL_CONN} extended-status |grep -w "Com_rollback"|cut -d"|" -f3
echo $result
;;
Questions)
result=${MYSQL_CONN} status|cut -f4 -d":"|cut -f1 -d"S"
echo $result
;;
Com_insert)
result=${MYSQL_CONN} extended-status |grep -w "Com_insert"|cut -d"|" -f3
echo $result
;;
Com_delete)
result=${MYSQL_CONN} extended-status |grep -w "Com_delete"|cut -d"|" -f3
echo $result
;;
Com_commit)
result=${MYSQL_CONN} extended-status |grep -w "Com_commit"|cut -d"|" -f3
echo $result
;;
Bytes_sent)
result=${MYSQL_CONN} extended-status |grep -w "Bytes_sent" |cut -d"|" -f3
echo $result
;;
Bytes_received)
result=${MYSQL_CONN} extended-status |grep -w "Bytes_received" |cut -d"|" -f3
echo $result
;;
Com_begin)
result=${MYSQL_CONN} extended-status |grep -w "Com_begin"|cut -d"|" -f3
echo $result
;;
#为正确关闭连接终止的连接数
Aborted_clients)
result=${MYSQL_CONN} extended-status |grep -w "Aborted_clients"|cut -d"|" -f3
echo $result
;;
#连接到Mysql服务器失败次数
Aborted_connects)
result=${MYSQL_CONN} extended-status |grep -w "Aborted_connects"|cut -d"|" -f3
echo $result
;;
#二进制日志缓存的已经存在的硬盘的条数
Binlog_cache_disk_use)
result=${MYSQL_CONN} extended-status |grep -w "Binlog_cache_disk_use"|cut -d"|" -f3
echo $result
;;
#二进制日志已缓存的条数(内存中)
result=${MYSQL_CONN} extended-status |grep -w "Binlog_cache_use"|cut -d"|" -f3
echo $result
;;
#服务器已运行时间
Uptime)
result=${MYSQL_CONN} extended-status |grep -w "Uptime"|cut -d"|" -f3
echo $result
;;
#激活的线程数
Threads_running)
result=${MYSQL_CONN} extended-status |grep -w "Threads_running"|cut -d"|" -f3
echo $result
;;
#创建用来处理连接的线程数
Threads_created)
result=${MYSQL_CONN} extended-status |grep -w "Threads_created"|cut -d"|" -f3
echo $result
;;
#当前打开的连接数量
Threads_connected)
result=${MYSQL_CONN} extended-status |grep -w "Threads_connected"|cut -d"|" -f3
echo $result
;;
#线程缓存内的线程数量
Threads_cached)
result=${MYSQL_CONN} extended-status |grep -w "Threads_cached"|cut -d"|" -f3
echo $result
;;
#立即释放表锁数
Table_locks_immediate)
result=${MYSQL_CONN} extended-status |grep -w "Table_locks_immediate"|cut -d"|" -f3
echo $result
;;
#等待表锁数
Table_locks_waited)
result=${MYSQL_CONN} extended-status |grep -w "Table_locks_waited"|cut -d"|" -f3
echo $result
;;
#是否开启了slave线程
Slave_running)
result=${MYSQL_CONN} extended-status |grep -w "Slave_running"|cut -d"|" -f3
echo $result
;;
#执行全表搜索查询数量
Select_scan)
result=${MYSQL_CONN} extended-status |grep -w "Select_scan"|cut -d"|" -f3
echo $result
;;
#命中
Qcache_hits)
result=${MYSQL_CONN} extended-status |grep -w "Qcache_hits"|cut -d"|" -f3
echo $result
;;
Qcache_free_memory)
result=${MYSQL_CONN} extended-status |grep -w "Qcache_free_memory"|cut -d"|" -f3
echo $result
;;
#包含数据的页数
Innodb_buffer_pool_pages_data)
result=${MYSQL_CONN} extended-status |grep -w "Innodb_buffer_pool_pages_data"|cut -d"|" -f3
echo $result
;;
#当前脏页数
Innodb_buffer_pool_pages_dirty)
result=${MYSQL_CONN} extended-status |grep -w "Innodb_buffer_pool_pages_dirty"|cut -d"|" -f3
echo $result
;;
#已经flush的页面数
Innodb_buffer_pool_pages_flushed)
result=${MYSQL_CONN} extended-status |grep -w "Innodb_buffer_pool_pages_flushed"|cut -d"|" -f3
echo $result
;;
#空页数
Innodb_buffer_pool_pages_free)
result=${MYSQL_CONN} extended-status |grep -w "Innodb_buffer_pool_pages_free"|cut -d"|" -f3
echo $result
;;
#优先用作管理的页数
Innodb_buffer_pool_pages_misc)
result=${MYSQL_CONN} extended-status |grep -w "Innodb_buffer_pool_pages_misc"|cut -d"|" -f3
echo $result
;;
#总页数
Innodb_buffer_pool_pages_total)
result=${MYSQL_CONN} extended-status |grep -w "Innodb_buffer_pool_pages_total"|cut -d"|" -f3
echo $result
;;
#随机读取的次数
Innodb_buffer_pool_read_ahead_rnd)
result=${MYSQL_CONN} extended-status |grep -w "Innodb_buffer_pool_read_ahead_rnd"|cut -d"|" -f3
echo $result
;;
#InnoDB已完成的逻辑读请求
Innodb_buffer_pool_read_requests)
result=${MYSQL_CONN} extended-status |grep -w "Innodb_buffer_pool_read_requests"|cut -d"|" -f3
echo $result
;;
#从磁盘上读取的页数
Innodb_buffer_pool_reads)
result=${MYSQL_CONN} extended-status |grep -w "Innodb_buffer_pool_reads"|cut -d"|" -f3
echo $result
;;
#缓冲池等待空闲的次数
Innodb_buffer_pool_wait_free)
result=${MYSQL_CONN} extended-status |grep -w "Innodb_buffer_pool_wait_free"|cut -d"|" -f3
echo $result
;;
#缓冲池总发出的请求次数
Innodb_buffer_pool_write_requests)
result=${MYSQL_CONN} extended-status |grep -w "Innodb_buffer_pool_wait_free"|cut -d"|" -f3
echo $result
;;
#fysncs()操作数
Innodb_data_fsyncs)
result=${MYSQL_CONN} extended-status |grep -w "Innodb_data_fsyncs"|cut -d"|" -f3
echo $result
;;
#总共读取的字节数
Innodb_data_read)
result=${MYSQL_CONN} extended-status |grep -w "Innodb_data_read"|cut -d"|" -f3
echo $result
;;
#Innodb完成的读的次数
Innodb_data_reads)
result=${MYSQL_CONN} extended-status |grep -w "Innodb_data_reads"|cut -d"|" -f3
echo $result
;;
#Innodb完成的写的次数
Innodb_data_writes)
result=${MYSQL_CONN} extended-status |grep -w "Innodb_data_writes"|cut -d"|" -f3
echo $result
;;
#InnoDB总写出的次数
Innodb_data_written)
result=${MYSQL_CONN} extended-status |grep -w "Innodb_data_written"|cut -d"|" -f3
echo $result
;;
#双写已经写好的页数
Innodb_dblwr_pages_written)
result=${MYSQL_CONN} extended-status |grep -w "Innodb_dblwr_pages_written"|cut -d"|" -f3
echo $result
;;
#已执行的双写操作数量
Innodb_dblwr_writes)
result=${MYSQL_CONN} extended-status |grep -w "Innodb_dblwr_writes"|cut -d"|" -f3
echo $result
;;
#日志写请求数
Innodb_log_write_requests)
result=${MYSQL_CONN} extended-status |grep -w "Innodb_log_write_requests"|cut -d"|" -f3
echo $result
;;
#向日志文件的物理写数量
Innodb_log_writes)
result=${MYSQL_CONN} extended-status |grep -w "Innodb_log_writes"|cut -d"|" -f3
echo $result
;;
#向日志文件完成的fsync()写入量
Innodb_os_log_fsyncs)
result=${MYSQL_CONN} extended-status |grep -w "Innodb_os_log_fsyncs"|cut -d"|" -f3
echo $result
;;
#写入文件的字节数
Innodb_os_log_written)
result=${MYSQL_CONN} extended-status |grep -w "Innodb_os_log_written"|cut -d"|" -f3
echo $result
;;
#编译的InnoDB页大小
Innodb_page_size)
result=${MYSQL_CONN} extended-status |grep -w "Innodb_page_size"|cut -d"|" -f3
echo $result
;;
#创建的页数
Innodb_pages_created)
result=${MYSQL_CONN} extended-status |grep -w "Innodb_pages_created"|cut -d"|" -f3
echo $result
;;
#从buffer_pool中读取的页数
Innodb_pages_read)
result=${MYSQL_CONN} extended-status |grep -w "Innodb_pages_read"|cut -d"|" -f3
echo $result
;;
#写入的页数
Innodb_pages_written)
result=${MYSQL_CONN} extended-status |grep -w "Innodb_pages_written"|cut -d"|" -f3
echo $result
;;
#删除
Innodb_rows_deleted)
result=${MYSQL_CONN} extended-status |grep -w "Innodb_rows_deleted"|cut -d"|" -f3
echo $result
;;
#插入
Innodb_rows_inserted)
result=${MYSQL_CONN} extended-status |grep -w "Innodb_rows_inserted"|cut -d"|" -f3
echo $result
;;
#从InnoDB表读取的行数
Innodb_rows_read)
result=${MYSQL_CONN} extended-status |grep -w "Innodb_rows_read"|cut -d"|" -f3
echo $result
;;
#更新
Innodb_rows_updated)
result=${MYSQL_CONN} extended-status |grep -w "Innodb_rows_updated"|cut -d"|" -f3
echo $result
;;
#未使用的缓存簇(blocks)数
Key_blocks_unused)
result=${MYSQL_CONN} extended-status |grep -w "Key_blocks_unused"|cut -d"|" -f3
echo $result
;;
#曾经用到的最大的blocks数
Key_blocks_used)
result=${MYSQL_CONN} extended-status |grep -w "Key_blocks_used"|cut -d"|" -f3
echo $result
;;
#一共有多少个索引请求
Key_read_requests)
result=${MYSQL_CONN} extended-status |grep -w "Key_read_requests"|cut -d"|" -f3
echo $result
;;
#一共发生了多少次物理IO
Key_reads)
result=${MYSQL_CONN} extended-status |grep -w "Key_reads"|cut -d"|" -f3
echo $result
;;
#当前打开的表数
Open_tables)
result=${MYSQL_CONN} extended-status |grep -w "Open_tables"|cut -d"|" -f3
echo $result
;;
#当前已打开的表数量
Opened_tables)
result=${MYSQL_CONN} extended-status |grep -w "Opened_tables"|cut -d"|" -f3
echo $result
;;
#当前打开的文件数
Open_files)
result=${MYSQL_CONN} extended-status |grep -w "Open_files"|cut -d"|" -f3
echo $result
;;
#当前已打开的文件数
Opened_files)
result=${MYSQL_CONN} extended-status |grep -w "Opened_files"|cut -d"|" -f3
echo $result
;;
Qcache_free_memory)
result=${MYSQL_CONN} extended-status |grep -w "Qcache_free_memory"|cut -d"|" -f3
echo $result
;;
#当Qcache_free_memory还有很多的时候Qcache_lowmem_prunes增高报警
Qcache_lowmem_prunes)
result=${MYSQL_CONN} extended-status |grep -w "Qcache_lowmem_prunes"|cut -d"|" -f3
echo $result
;;
#mysql系统接收的查询的次数(包括存储过程内部的查询)
Queries)
result=${MYSQL_CONN} extended-status |grep -w "Queries"|cut -d"|" -f3
echo $result
;;
#应用到其他表,没有使用索引的联接的数量
Select_full_join)
result=${MYSQL_CONN} extended-status |grep -w "Select_full_join"|cut -d"|" -f3
echo $result
;;
#仅应用到第一个表,在第一个表中使用范围的联接的数量
Select_range)
result=${MYSQL_CONN} extended-status |grep -w "Select_range"|cut -d"|" -f3
echo $result
;;
#应用到其他表
Select_range_check)
result=${MYSQL_CONN} extended-status |grep -w "Select_range_check"|cut -d"|" -f3
echo $result
;;
#立即释放表锁数
Table_locks_immediate)
result=${MYSQL_CONN} extended-status |grep -w "Table_locks_immediate"|cut -d"|" -f3
echo $result
;;
#需要等待的表锁数
Table_locks_waited)
result=${MYSQL_CONN} extended-status |grep -w "Table_locks_waited"|cut -d"|" -f3
echo $result
;;
#表缓存查找的命中数
Table_open_cache_hits)
result=${MYSQL_CONN} extended-status |grep -w "Table_open_cache_hits"|cut -d"|" -f3
echo $result
;;
#表缓存查找的未命中数
Table_open_cache_misses)
result=${MYSQL_CONN} extended-status |grep -w "Table_open_cache_misses"|cut -d"|" -f3
echo $result
;;*)
help
;;
esac
第一个脚本是所有参数的一个提取过程,然后我们可以在系统上直接提取参数了,接下来我们开始做key,怎么做了如下:
UserParameter=mysql_discovery[],/bin/bash /data/zabbix/scripts/mysql_discovery.py
UserParameter=mysql.status[],/data/zabbix/scripts/check_mysql.sh $1 $2
UserParameter=mysql.ping[*],/data/zabbix/scripts/check_mysql.sh ping $1
然后我们就可以去zabbix_server服务器端去get值去了,这是上边比较简单的监控方法。其中的那个值说白了只要我命令能获取到值我都能监控起来,空气中的二氧化碳也不例外。
第二种方法就是分步自己写少量对自己有用的参数就行监控就好了。话不多说打字挺累的,直接上脚本。
1、获取mysql状态(mysql性能数据,通过mysqldump)
#!/bin/bash
one=
ps xua|grep mysqld|grep -w "port=3307"|wc -l
if [ $one -lt 1 ];thensocket=
ps xua|grep -w "socket"|grep -v "mysqld_safe"|awk ‘BEGIN {FS="--socket="} {print $2}‘|awk ‘{print $1}‘|grep sock|tail -n 1
mysqladmin -r ext -uzabbix -pzabbix -P 3307 -S $socket 2>/dev/null|grep -w "$2"|awk ‘{print $4}‘else
socket=
ps xua|grep -w "socket"|grep -v "mysqld_safe"|grep -w "port=$1"|awk ‘BEGIN {FS="--socket="} {print $2}‘|awk ‘{print $1}‘
mysqladmin -r ext -uzabbix -pzabbix -P $1 -S $socket 2>/dev/null|grep -w "$2"|awk ‘{print $4}‘
fi
2、获取mysql主从复制状态
#!/bin/bash
one=
ps xua|grep mysqld|grep -w "port=3307"|wc -lif [ $one -lt 1 ];then
socket=`ps xua|grep -w "socket"|grep -v "mysqld_safe"|awk ‘BEGIN {FS="--socket="} {print $2}‘|awk ‘{print $1}‘|grep  sock|tail -n 1`
 mysql -uzabbix -pzabbix  -P 3307 -S $socket -e "show slave status\G" 2>/dev/null|grep -w "$2"|awk ‘{print $2}‘
else
socket=ps xua|grep -w "socket"|grep -v "mysqld_safe"|grep -w "port=$1"|awk ‘BEGIN {FS="--socket="} {print $2}‘|awk ‘{print $1}‘
mysql -uzabbix -pzabbix -P $1 -S $socket -e "show slave status\G" 2>/dev/null|grep -w "$2"|awk ‘{print $2}‘
fi
3、mysql存活状态
#!/bin/bash
one=
ps xua|grep mysqld|grep -w "port=3307"|wc -lif [ $one -lt 1 ];then
socket=`ps xua|grep -w "socket"|grep -v "mysqld_safe"|awk ‘BEGIN {FS="--socket="} {print $2}‘|awk ‘{print $1}‘|grep sock|tail -n 1`
 mysqladmin -h localhost -P 3307 -S $socket -uzabbix -p‘zabbix‘ ping 2>/dev/null| grep -c alive
else
socket=ps xua|grep -w "socket"|grep -v "mysqld_safe"|grep -w "port=$1"|awk ‘BEGIN {FS="--socket="} {print $2}‘|awk ‘{print $1}‘
mysqladmin -h localhost -P $1 -S $socket -uzabbix -p‘zabbix‘ ping 2>/dev/null| grep -c alive
fi
4、自定义key
这一部分不用教大家了,自己根据自己实际路径脚本名称想定义成什么key去定义就好了。
最后给大家看一下监控完成后的样子就好了:


OK完成了。不懂得请留言谢谢,不一定及时回信息,但是看到一定回信息。加油向小米飞猫看齐。
ZABBIX最全MYSQL自定义监控多实例mysql与主从复制状态没有之一
标签:os.path -o cas lines 命令 for 通过 失败 主机地址
原文地址:http://blog.51cto.com/13120271/2176322