标签:变量 pytho ova val form value alpha figure mod
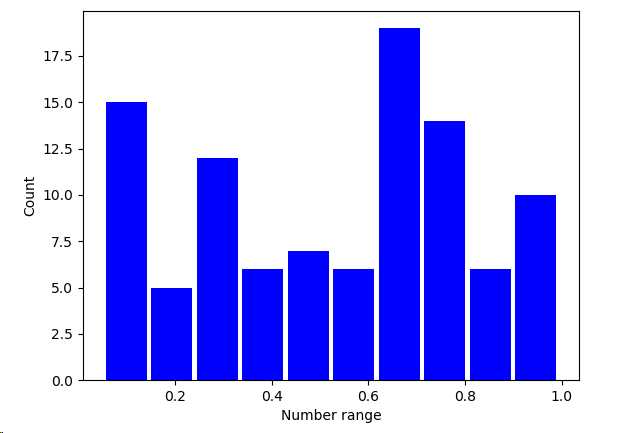
import matplotlib.pyplot as plt
import numpy as np

SAMPLE_SIZE = 100

np.random.seed()
real_rand_vars = [np.random.random() for _ in range(SAMPLE_SIZE)]

plt.figure()
plt.hist(real_rand_vars, rwidth=0.9, color=‘blue‘)
plt.xlabel(‘Number range‘)
plt.ylabel(‘Count‘)
plt.show()
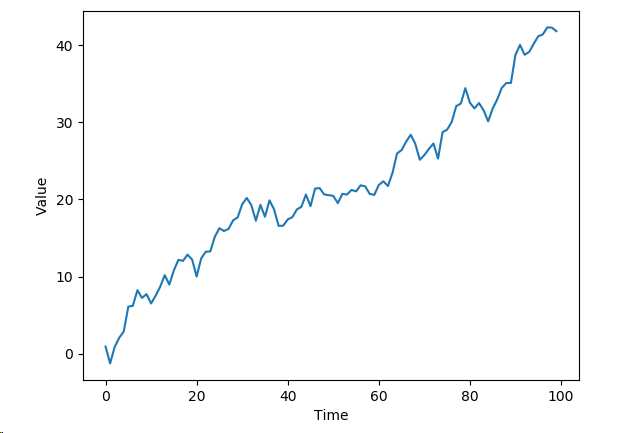
import matplotlib.pyplot as plt
import numpy as np

duration = 100
mean_inc = 0.2
std_dev_inc = 1.2

x = range(duration)
y = []
price_today = 0

for i in x:
    next_delta = np.random.normal(mean_inc, std_dev_inc)
    price_today += next_delta
    y.append(price_today)

plt.figure()
plt.plot(x, y)
plt.xlabel(‘Time‘)
plt.ylabel(‘Value‘)
plt.show()
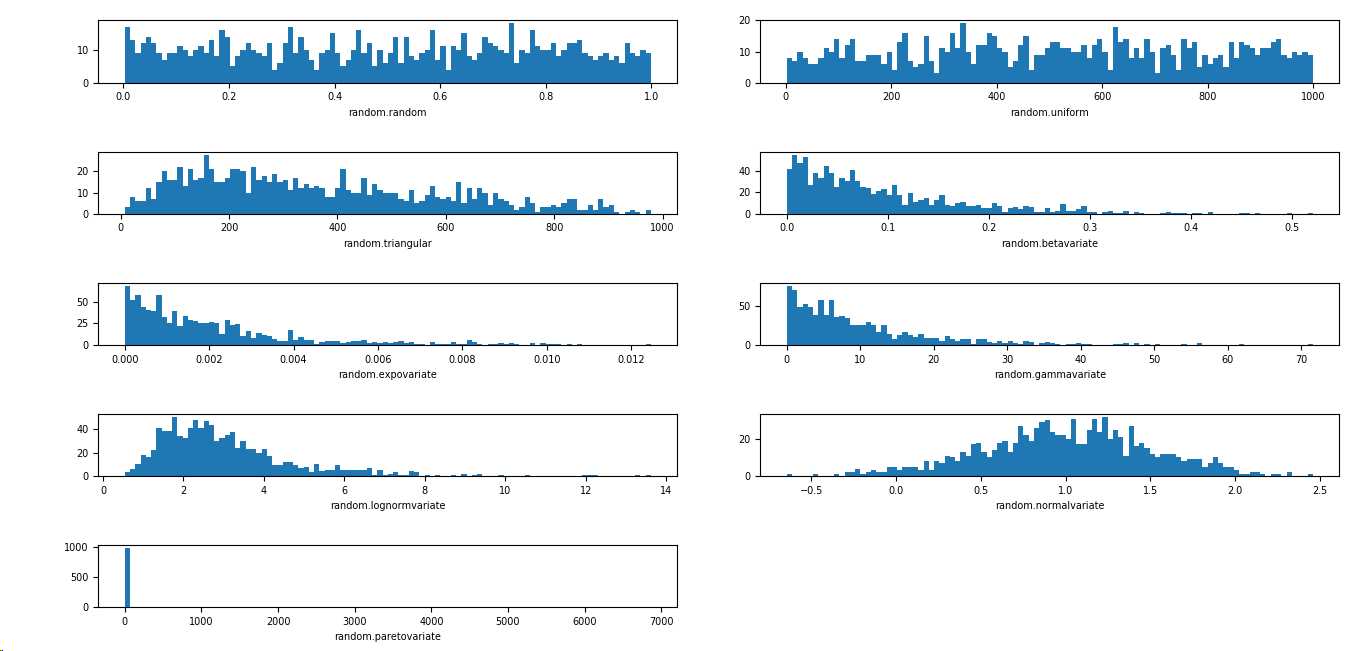
import matplotlib.pyplot as plt
import numpy as np
import matplotlib

SAMPLE_SIZE = 1000
buckets = 100
matplotlib.rcParams.update({‘font.size‘:7})

plt.figure()
# 第一个图是 [0,1) 之间分布的随机变量
plt.subplot(521)
plt.xlabel(‘random.random‘)
res = [np.random.random() for _ in range(1, SAMPLE_SIZE)]
plt.hist(x=res, bins=buckets)
# 第二个图是一个均匀分布的随机变量
plt.subplot(522)
plt.xlabel(‘random.uniform‘)
a = 1
b = SAMPLE_SIZE
res = [np.random.uniform(a, b) for _ in range(1, SAMPLE_SIZE)]
plt.hist(x=res, bins=buckets)
# 第三个图是一个三角形分布
plt.subplot(523)
plt.xlabel(‘random.triangular‘)
low = 1
mode = 100.0
high = SAMPLE_SIZE
res = [np.random.triangular(low, mode, high) for _ in range(1, SAMPLE_SIZE)]
plt.hist(x=res, bins=buckets)
# 第四个图是一个 beta 分布
plt.subplot(524)
plt.xlabel(‘random.betavariate‘)
alpha = 1
beta = 10
res = [np.random.beta(alpha, beta) for _ in range(1, SAMPLE_SIZE)]
plt.hist(x=res, bins=buckets)
# 第五个图是一个指数分布
plt.subplot(525)
plt.xlabel(‘random.expovariate‘)
lambd = 1.0 / ((SAMPLE_SIZE + 1) / 2.0)
res = [np.random.exponential(lambd) for _ in range(1, SAMPLE_SIZE)]
plt.hist(x=res, bins=buckets)
# 第六个图是一个 gamma 分布
plt.subplot(526)
plt.xlabel(‘random.gammavariate‘)
alpha = 1
beta = 10
res = [np.random.gamma(alpha, beta) for _ in range(1, SAMPLE_SIZE)]
plt.hist(x=res, bins=buckets)
# 第七个图是一个 对数正态分布
plt.subplot(527)
plt.xlabel(‘random.lognormvariate‘)
mu = 1
sigma = 0.5
res = [np.random.lognormal(mu, sigma) for _ in range(1, SAMPLE_SIZE)]
plt.hist(x=res, bins=buckets)
# 第八个图是一个正态分布
plt.subplot(528)
plt.xlabel(‘random.normalvariate‘)
mu = 1
sigma = 0.5
res = [np.random.normal(mu, sigma) for _ in range(1, SAMPLE_SIZE)]
plt.hist(x=res, bins=buckets)
# 第九个图是一个帕累托分布
plt.subplot(529)
plt.xlabel(‘random.paretovariate‘)
alpha = 1
res = [np.random.pareto(alpha) for _ in range(1, SAMPLE_SIZE)]
plt.hist(x=res, bins=buckets)

plt.tight_layout()
plt.show()
标签:变量 pytho ova val form value alpha figure mod
原文地址:https://www.cnblogs.com/0820LL/p/10363619.html