标签:plot div 数据可视化 xtend bar smooth 一个 sig accept
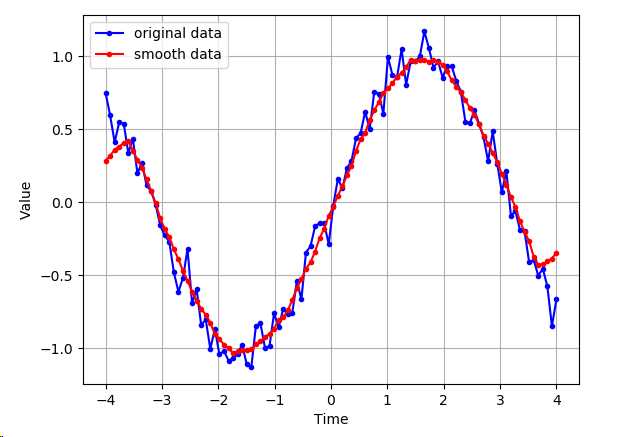
平滑数据噪声的一个简单朴素的做法是,对窗口(样本)求平均,然后仅仅绘制出给定窗口的平均值,而不是所有的数据点。
import matplotlib.pyplot as plt
import numpy as np

def moving_average(interval, window_size):
    window = np.ones(int(window_size)) / float(window_size)
    return np.convolve(interval, window, ‘same‘)

t = np.linspace(start = -4, stop = 4, num = 100)
y = np.sin(t) + np.random.randn(len(t)) * 0.1
y_av = moving_average(interval = y, window_size = 10)
plt.plot(t, y, "b.-", t, y_av, "r.-")

plt.xlabel(‘Time‘)
plt.ylabel(‘Value‘)
plt.legend([‘original data‘, ‘smooth data‘])
plt.grid(True)
plt.show()
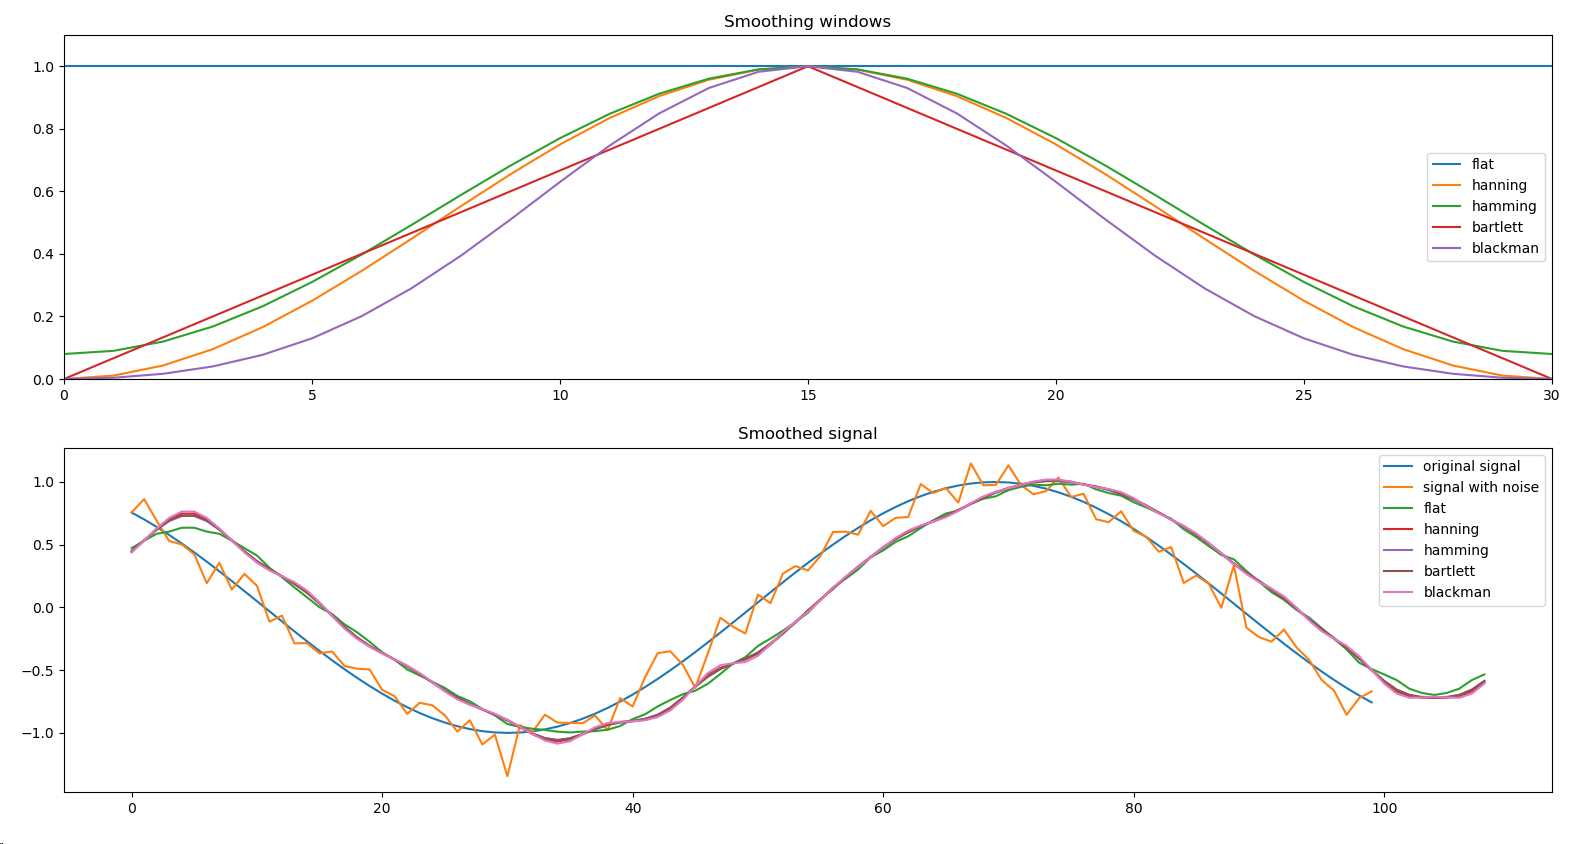
以下方法是基于信号(数据点)窗口的卷积(函数的总和)
import matplotlib.pyplot as plt
import numpy as np

WINDOWS = [‘flat‘, ‘hanning‘, ‘hamming‘, ‘bartlett‘, ‘blackman‘]

def smooth(x, window_len = 11, window = ‘hanning‘):
    if x.ndim != 1:
        raise ValueError(‘smooth only accepts 1 dimension arrays.‘)
    if x.size < window_len:
        raise ValueError(‘Input vector needs to be bigger than window size.‘)
    if window_len < 3:
        return x
    if not window in WINDOWS:
        raise ValueError(‘Window is one of "flat", "hanning", "hamming", "bartlett", "blackman"‘)
    s = np.r_[x[window_len-1:0:-1], x, x[-1:-window_len:-1]]
    if window == ‘flat‘:
        w = np.ones(window_len, ‘d‘)
    else:
        w = eval(‘np.‘ + window + ‘(window_len)‘)
    y = np.convolve(w/w.sum(), s, mode=‘valid‘)
    return y

t = np.linspace(-4, 4, 100)
x = np.sin(t)
xn = x + np.random.randn(len(t))*0.1

y = smooth(x)
ws = 31

plt.figure()

plt.subplot(211)
plt.plot(np.ones(ws))
for w in WINDOWS[1:]:
    eval(‘plt.plot(np.‘ + w + ‘(ws))‘)
plt.axis([0, 30, 0, 1.1])
plt.legend(WINDOWS)
plt.title(‘Smoothing windows‘)

plt.subplot(212)
plt.plot(x)
plt.plot(xn)
for w in WINDOWS:
    plt.plot(smooth(xn, 10, w))
l = [‘original signal‘, ‘signal with noise‘]
l.extend(WINDOWS)
plt.legend(l)
plt.title(‘Smoothed signal‘)

plt.show()
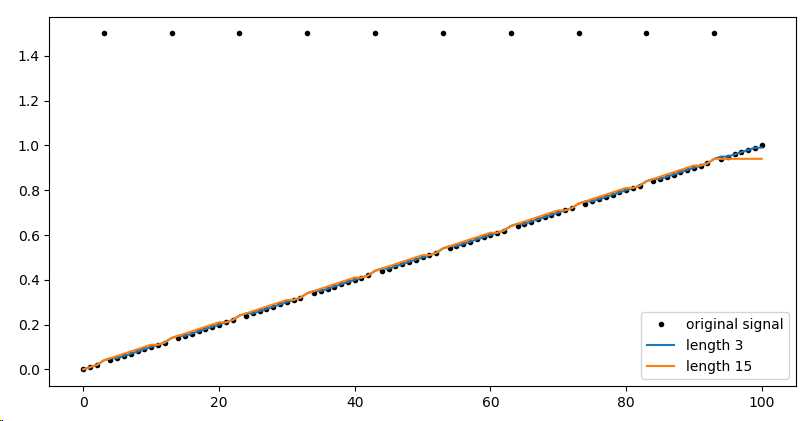
中值过滤,即逐项的遍历信号,并用相邻信号项中的中值替代当前项
import matplotlib.pyplot as plt
import numpy as np
import scipy.signal as signal

x = np.linspace(start=0, stop=1, num=101)
x[3::10] = 1.5
print(x)
plt.plot(x, ‘k.‘)
plt.plot(signal.medfilt(x,3))
plt.plot(signal.medfilt(x,15))
plt.legend([‘original signal‘, ‘length 3‘, ‘length 15‘])
plt.show()
标签:plot div 数据可视化 xtend bar smooth 一个 sig accept
原文地址:https://www.cnblogs.com/0820LL/p/10363635.html