标签:spi 技术 axis one label mamicode .com src info
首先定·定义x, y创建一个figure
1 import numpy as np
2 import matplotlib.pyplot as plt
3 x = np.linspace(-1, 1, 10)
4 y1 = 2*x
5 y2 = x*x
6 plt.figure()
使用plt.plot()画图
plt.plot(x, y1)
plt.plot(x, y2, color="blue", linestyle="--", linewidth=1.0)
使用plt.xlabel()以及plt.ylabel()对坐标轴进行标注
plt.xlabel("x label")
plt.ylabel("y label")
使用xticks()以及ysticks()设置坐标轴刻度
x_stick = np.linspace(-1, 1, 5)
plt.xticks(x_stick)
plt.yticks([1, 2, 3, 4], ["$bad\ xixi$", "$ordinary$", "$good$", "$best$"])
使用plt.gca()获取坐标轴信息
ax = plt.gca()
我们可以对坐标轴的进行各种设置(包含将坐标轴交点设为(0,0)的方法)
#使用spines设置边框,共有("left","right","top","bottom")四种选项,使用set_color()设置颜色
ax.spines["right"].set_color("none")
ax.spines["top"].set_color("none")
#将左边框放到x=0的位置,将下边框放大y=0的位置
ax.spines["bottom"].set_position(("data", 0))
ax.spines["left"].set_position(("data", 0))
使用xaxis.set_ticks_position()以及yaxis.set_ticks_position()设置x或y坐标刻度或名称的位置
# 所有位置:top,bottom,both,default,none
ax.xaxis.set_ticks_position(‘top‘)
ax.xaxis.set_label_position(‘top‘)
# 所有位置:left,right,both,default,none
ax.yaxis.set_ticks_position(‘right‘)
ax.yaxis.set_label_position(‘right‘)
使用plt.show()画图
plt.show()
所有代码
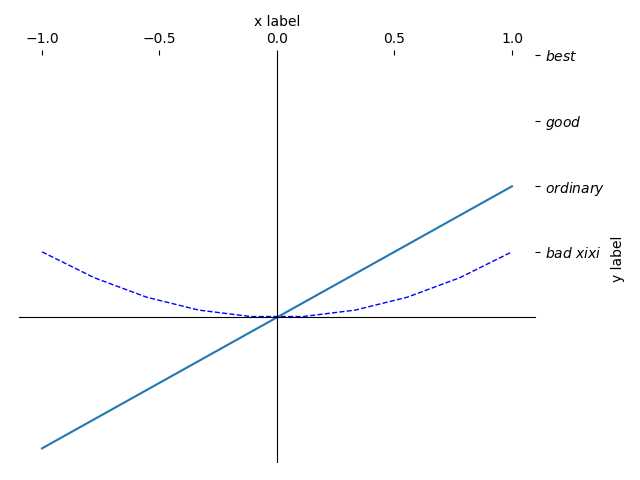
import numpy as np
import matplotlib.pyplot as plt

x = np.linspace(-1, 1, 10)
y1 = 2*x
y2 = x*x
plt.figure()
plt.plot(x, y1)
plt.plot(x, y2, color="blue", linestyle="--", linewidth=1.0)

plt.xlabel("x label")
plt.ylabel("y label")

x_stick = np.linspace(-1, 1, 5)
plt.xticks(x_stick)
plt.yticks([1, 2, 3, 4], ["$bad\ xixi$", "$ordinary$", "$good$", "$best$"])

ax = plt.gca()
#使用spines设置边框,共有("left","right","top","bottom")四种选项,使用set_color()设置颜色
ax.spines["right"].set_color("none")
ax.spines["top"].set_color("none")
#将底部边框放大y=0的位置
ax.spines["bottom"].set_position(("data", 0))
ax.spines["left"].set_position(("data", 0))
# 所有位置:top,bottom,both,default,none
ax.xaxis.set_ticks_position(‘top‘)
ax.xaxis.set_label_position(‘top‘)
# 所有位置:left,right,both,default,none
ax.yaxis.set_ticks_position(‘right‘)
ax.yaxis.set_label_position(‘right‘)

plt.show()
结果:
标签:spi 技术 axis one label mamicode .com src info
原文地址:https://www.cnblogs.com/ahochen/p/10702817.html