标签:metadata dir tar ica label web use tom server
日志系统:
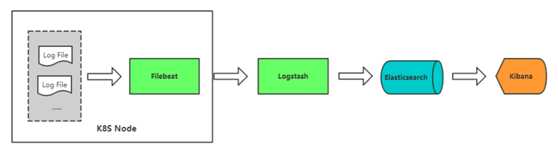
安装jdk
[root@localhost ~]# yum install java-1.8.0-openjdk
[root@localhost ~]# java -version
openjdk version "1.8.0_212"
OpenJDK Runtime Environment (build 1.8.0_212-b04)
OpenJDK 64-Bit Server VM (build 25.212-b04, mixed mode)

安装elk组件
[root@localhost ~]# yum install elasticsearch logstash kibana
启动es
[root@localhost ~]# systemctl start elasticsearch

启动kibana
[root@localhost ~]# vim /etc/kibana/kibana.yml
server.host: "0.0.0.0"
elasticsearch.hosts: ["http://localhost:9200"]
[root@localhost ~]# systemctl start kibana

启动logstash
[root@localhost ~]# cat /etc/logstash/conf.d/logstash-to-es.conf
input {
  beats {
    port => 5044
  }
}

filter {
}

output {
    if [app] == "www" {
    if [type] == "nginx-access" {
         elasticsearch {
        hosts => ["http://127.0.0.1:9200"]
        index => "nginx-access-%{+YYYY.MM.dd}"
             }
    }
    else if [type] == "nginx-error" {
        elasticsearch {
                hosts => ["http://127.0.0.1:9200"]
                index => "nginx-error-%{+YYYY.MM.dd}"
             }
    }
        else if [type] == "tomcat-catalina" {
            elasticsearch {
                hosts => ["http://127.0.0.1:9200"]
                index => "tomcat-catalina-%{+YYYY.MM.dd}"
             }
        }
    }
        else if [app] == "k8s" {
        if [type] == "module" {
        elasticsearch {
            hosts => ["http://127.0.0.1:9200"]
            index => "k8s-log-%{+YYYY.MM.dd}"
        }
        }
        }
    stdout { codec => rubydebug }
}
[root@localhost ~]# /usr/share/logstash/bin/logstash -f /etc/logstash/conf.d/logstash-to-es.conf
启动收集日志的容器(filebeat)
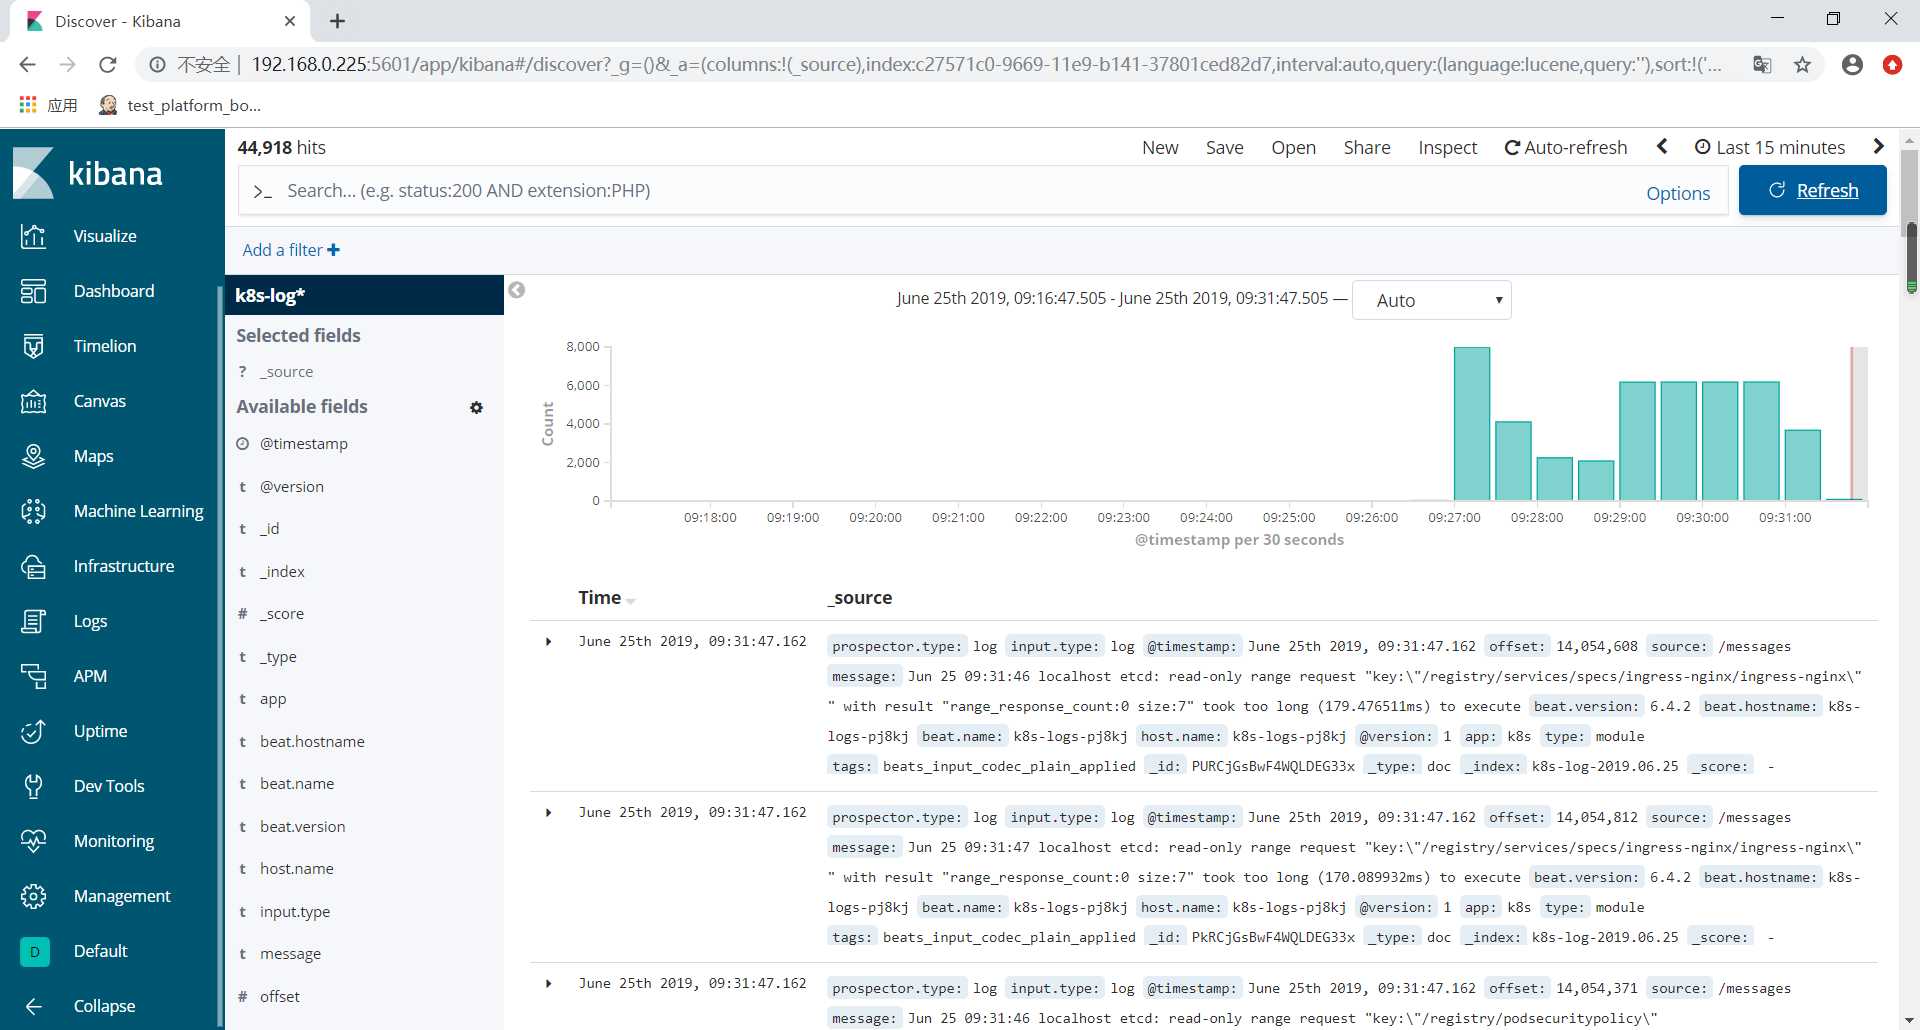
[root@localhost elk]# cat k8s-logs.yaml
apiVersion: v1
kind: ConfigMap
metadata:
  name: k8s-logs-filebeat-config
  namespace: kube-system

data:
  filebeat.yml: |-
    filebeat.prospectors:
      - type: log
        paths:
          - /messages
        fields:
          app: k8s
          type: module
        fields_under_root: true

    output.logstash:
      hosts: [‘192.168.0.225:5044‘]

---

apiVersion: apps/v1
kind: DaemonSet
metadata:
  name: k8s-logs
  namespace: kube-system
spec:
  selector:
    matchLabels:
      project: k8s
      app: filebeat
  template:
    metadata:
      labels:
        project: k8s
        app: filebeat
    spec:
      containers:
      - name: filebeat
        image: docker.elastic.co/beats/filebeat:6.4.2
        args: [
          "-c", "/etc/filebeat.yml",
          "-e",
        ]
        resources:
          requests:
            cpu: 100m
            memory: 100Mi
          limits:
            cpu: 500m
            memory: 500Mi
        securityContext:
          runAsUser: 0
        volumeMounts:
        - name: filebeat-config
          mountPath: /etc/filebeat.yml
          subPath: filebeat.yml
        - name: k8s-logs
          mountPath: /messages
      volumes:
      - name: k8s-logs
        hostPath:
          path: /var/log/messages
          type: File
      - name: filebeat-config
        configMap:
          name: k8s-logs-filebeat-config

[root@localhost elk]# kubectl apply -f k8s-logs.yaml
configmap/k8s-logs-filebeat-config created
[root@localhost elk]# kubectl get pod -n kube-system
NAME                                    READY   STATUS    RESTARTS   AGE
alertmanager-6b5bbd5bd4-lgjn8           2/2     Running   0          7d4h
coredns-5b8c57999b-z9jh8                1/1     Running   1          28d
grafana-0                               1/1     Running   3          10d
k8s-logs-b6f4v                          1/1     Running   0          6m30s
k8s-logs-lz5pn                          1/1     Running   0          6m30s
k8s-logs-pj8kj                          1/1     Running   0          6m30s
kube-state-metrics-f86fd9f4f-j4rdc      2/2     Running   0          7d7h
kubernetes-dashboard-644c96f9c6-bvw8w   1/1     Running   1          28d
prometheus-0                            2/2     Running   0          7d3h
访问kibana,添加index
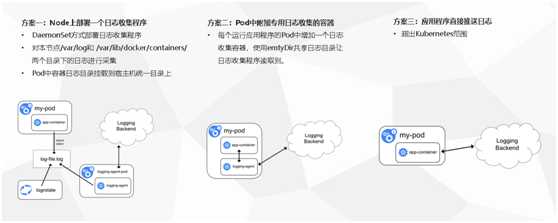
容器中的日志怎么收集
|
方式 |
优点 |
缺点 |
|
方案一:Node上部署一个日志收集程序 |
每个Node仅需部署一个日志收集程序,资源消耗少,对应用无侵入 |
应用程序日志需要写到标准输出和标准错误输出,不支持多行日志 |
|
方案二:Pod中附加专用日志收集的容器 |
低耦合 |
每个Pod启动一个日志收集代理,增加资源消耗,并增加运维维护成本 |
|
方案三:应用程序直接推送日志 |
无需额外收集工具 |
浸入应用,增加应用复杂度 |
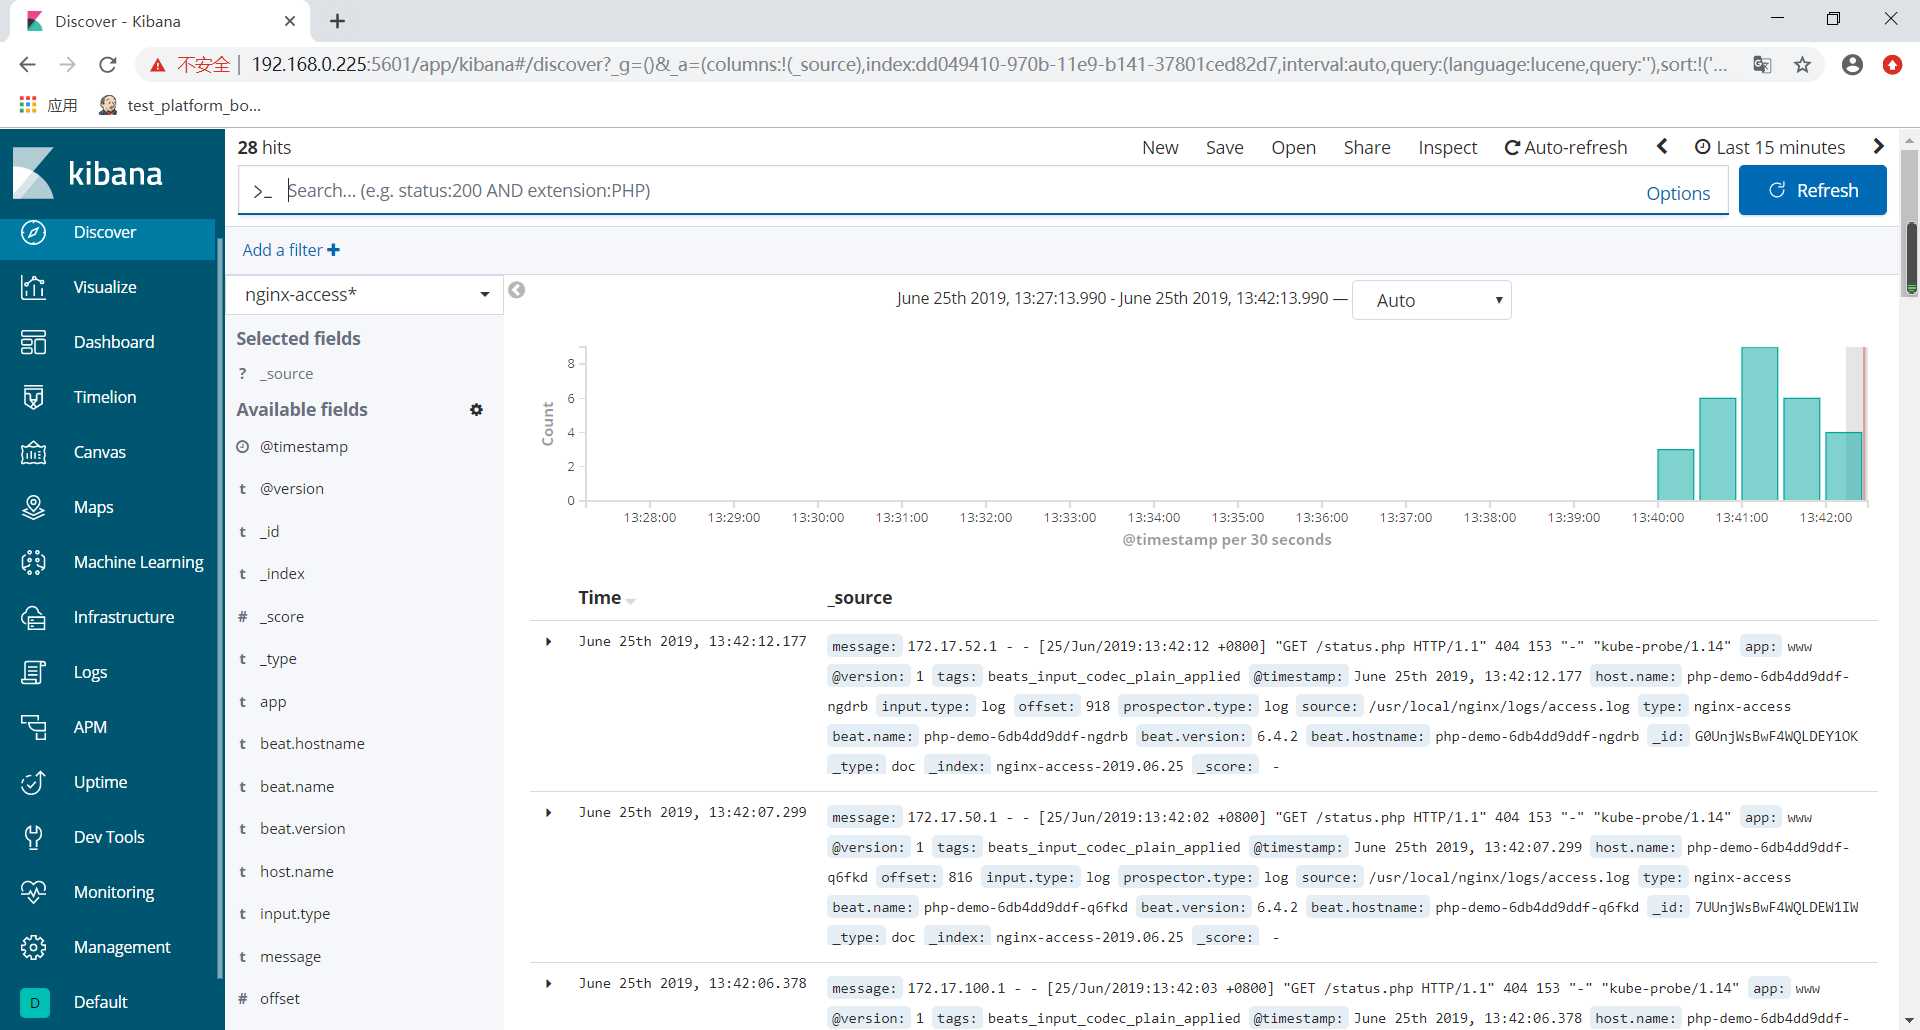
nginx日志收集
[root@localhost elk]# cat filebeat-nginx-configmap.yaml
apiVersion: v1
kind: ConfigMap
metadata:
  name: filebeat-nginx-config
  namespace: test

data:
  filebeat.yml: |-
    filebeat.prospectors:
      - type: log
        paths:
          - /usr/local/nginx/logs/access.log
        # tags: ["access"]
        fields:
          app: www
          type: nginx-access
        fields_under_root: true

      - type: log
        paths:
          - /usr/local/nginx/logs/error.log
        # tags: ["error"]
        fields:
          app: www
          type: nginx-error
        fields_under_root: true

    output.logstash:
      hosts: [‘192.168.0.225:5044‘]
[root@localhost elk]# kubectl apply -f filebeat-nginx-configmap.yaml
configmap/filebeat-nginx-config unchanged

[root@localhost elk]# cat nginx-deployment.yaml
apiVersion: apps/v1beta1
kind: Deployment
metadata:
  name: php-demo
  namespace: test
spec:
  replicas: 3
  selector:
    matchLabels:
      project: www
      app: php-demo
  template:
    metadata:
      labels:
        project: www
        app: php-demo
    spec:
      imagePullSecrets:
      - name: registry-pull-secret
      containers:
      - name: nginx
        image: 192.168.0.223/project/nginx:v1
        imagePullPolicy: Always
        ports:
        - containerPort: 80
          name: web
          protocol: TCP
        resources:
          requests:
            cpu: 0.5
            memory: 256Mi
          limits:
            cpu: 1
            memory: 1Gi
        resources:
          requests:
            cpu: 0.5
            memory: 256Mi
          limits:
            cpu: 1
            memory: 1Gi
        livenessProbe:
          httpGet:
            path: /status.php
            port: 80
          initialDelaySeconds: 6
          timeoutSeconds: 20
        volumeMounts:
        - name: nginx-logs
          mountPath: /usr/local/nginx/logs

      - name: filebeat
        image: docker.elastic.co/beats/filebeat:6.4.2
        args: [
          "-c", "/etc/filebeat.yml",
          "-e",
        ]
        resources:
          limits:
            memory: 500Mi
          requests:
            cpu: 100m
            memory: 100Mi
        securityContext:
          runAsUser: 0
        volumeMounts:
        - name: filebeat-config
          mountPath: /etc/filebeat.yml
          subPath: filebeat.yml
        - name: nginx-logs
          mountPath: /usr/local/nginx/logs

      volumes:
      - name: nginx-logs
        emptyDir: {}
      - name: filebeat-config
        configMap:
          name: filebeat-nginx-config
[root@localhost elk]# kubectl apply -f nginx-deployment.yaml
deployment.apps/php-demo configured
tomcat日志收集
[root@localhost elk]# cat filebeat-tomcat-configmap.yaml
apiVersion: v1
kind: ConfigMap
metadata:
  name: filebeat-config
  namespace: test

data:
  filebeat.yml: |-
    filebeat.prospectors:
    - type: log
      paths:
        - /usr/local/tomcat/logs/catalina.*
      # tags: ["tomcat"]
      fields:
        app: www
        type: tomcat-catalina
      fields_under_root: true
      multiline:
        pattern: ‘^\[‘
        negate: true
        match: after
    output.logstash:
      hosts: [‘192.168.0.225:5044‘]
[root@localhost elk]# kubectl apply -f filebeat-tomcat-configmap.yaml
configmap/filebeat-config created

[root@localhost elk]# cat tomcat-deployment.yaml
apiVersion: apps/v1beta1
kind: Deployment
metadata:
  name: tomcat-java-demo
  namespace: test
spec:
  replicas: 3
  selector:
    matchLabels:
      project: www
      app: java-demo
  template:
    metadata:
      labels:
        project: www
        app: java-demo
    spec:
      imagePullSecrets:
      - name: registry-pull-secret
      containers:
      - name: tomcat
        image: 192.168.0.223/project/tomcat-java-demo:latest
        imagePullPolicy: Always
        ports:
        - containerPort: 8080
          name: web
          protocol: TCP
        resources:
          requests:
            cpu: 0.5
            memory: 1Gi
          limits:
            cpu: 1
            memory: 2Gi
        livenessProbe:
          httpGet:
            path: /
            port: 8080
          initialDelaySeconds: 60
          timeoutSeconds: 20
        readinessProbe:
          httpGet:
            path: /
            port: 8080
          initialDelaySeconds: 60
          timeoutSeconds: 20
        volumeMounts:
        - name: tomcat-logs
          mountPath: /usr/local/tomcat/logs

      - name: filebeat
        image: docker.elastic.co/beats/filebeat:6.4.2
        args: [
          "-c", "/etc/filebeat.yml",
          "-e",
        ]
        resources:
          limits:
            memory: 500Mi
          requests:
            cpu: 100m
            memory: 100Mi
        securityContext:
          runAsUser: 0
        volumeMounts:
        - name: filebeat-config
          mountPath: /etc/filebeat.yml
          subPath: filebeat.yml
        - name: tomcat-logs
          mountPath: /usr/local/tomcat/logs
      volumes:
      - name: tomcat-logs
        emptyDir: {}
      - name: filebeat-config
        configMap:
          name: filebeat-config
[root@localhost elk]# kubectl apply -f tomcat-deployment.yaml
deployment.apps/tomcat-java-demo created
标签:metadata dir tar ica label web use tom server
原文地址:https://www.cnblogs.com/yuezhimi/p/11081093.html