标签:container socket 组件 let key osc policy 相对 基于
在上一篇文章中,给大家介绍和剖析了 HPA 的实现原理以及演进的思路与历程。本文我们将会为大家讲解如何使用 HPA 以及一些需要注意的细节。
autoscaling/v1 实践v1 的模板可能是大家平时见到最多的也是最简单的,v1 版本的 HPA 只支持一种指标 —— CPU。传统意义上,弹性伸缩最少也会支持 CPU 与 Memory 两种指标,为什么在 Kubernetes 中只放开了 CPU 呢?其实最早的 HPA 是计划同时支持这两种指标的,但是实际的开发测试中发现:内存不是一个非常好的弹性伸缩判断条件。因为和 CPU不 同,很多内存型的应用,并不会因为 HPA 弹出新的容器而带来内存的快速回收,很多应用的内存都要交给语言层面的 VM 进行管理,也就是说,内存的回收是由 VM 的 GC 来决定的。这就有可能因为 GC 时间的差异导致 HPA 在不恰当的时间点震荡,因此在 v1 的版本中,HPA 就只支持了 CPU 这一种指标。
一个标准的 v1 模板大致如下:
apiVersion: autoscaling/v1
kind: HorizontalPodAutoscaler
metadata:
  name: php-apache
  namespace: default
spec:
  scaleTargetRef:
    apiVersion: apps/v1
    kind: Deployment
    name: php-apache
  minReplicas: 1
  maxReplicas: 10
  targetCPUUtilizationPercentage: 50
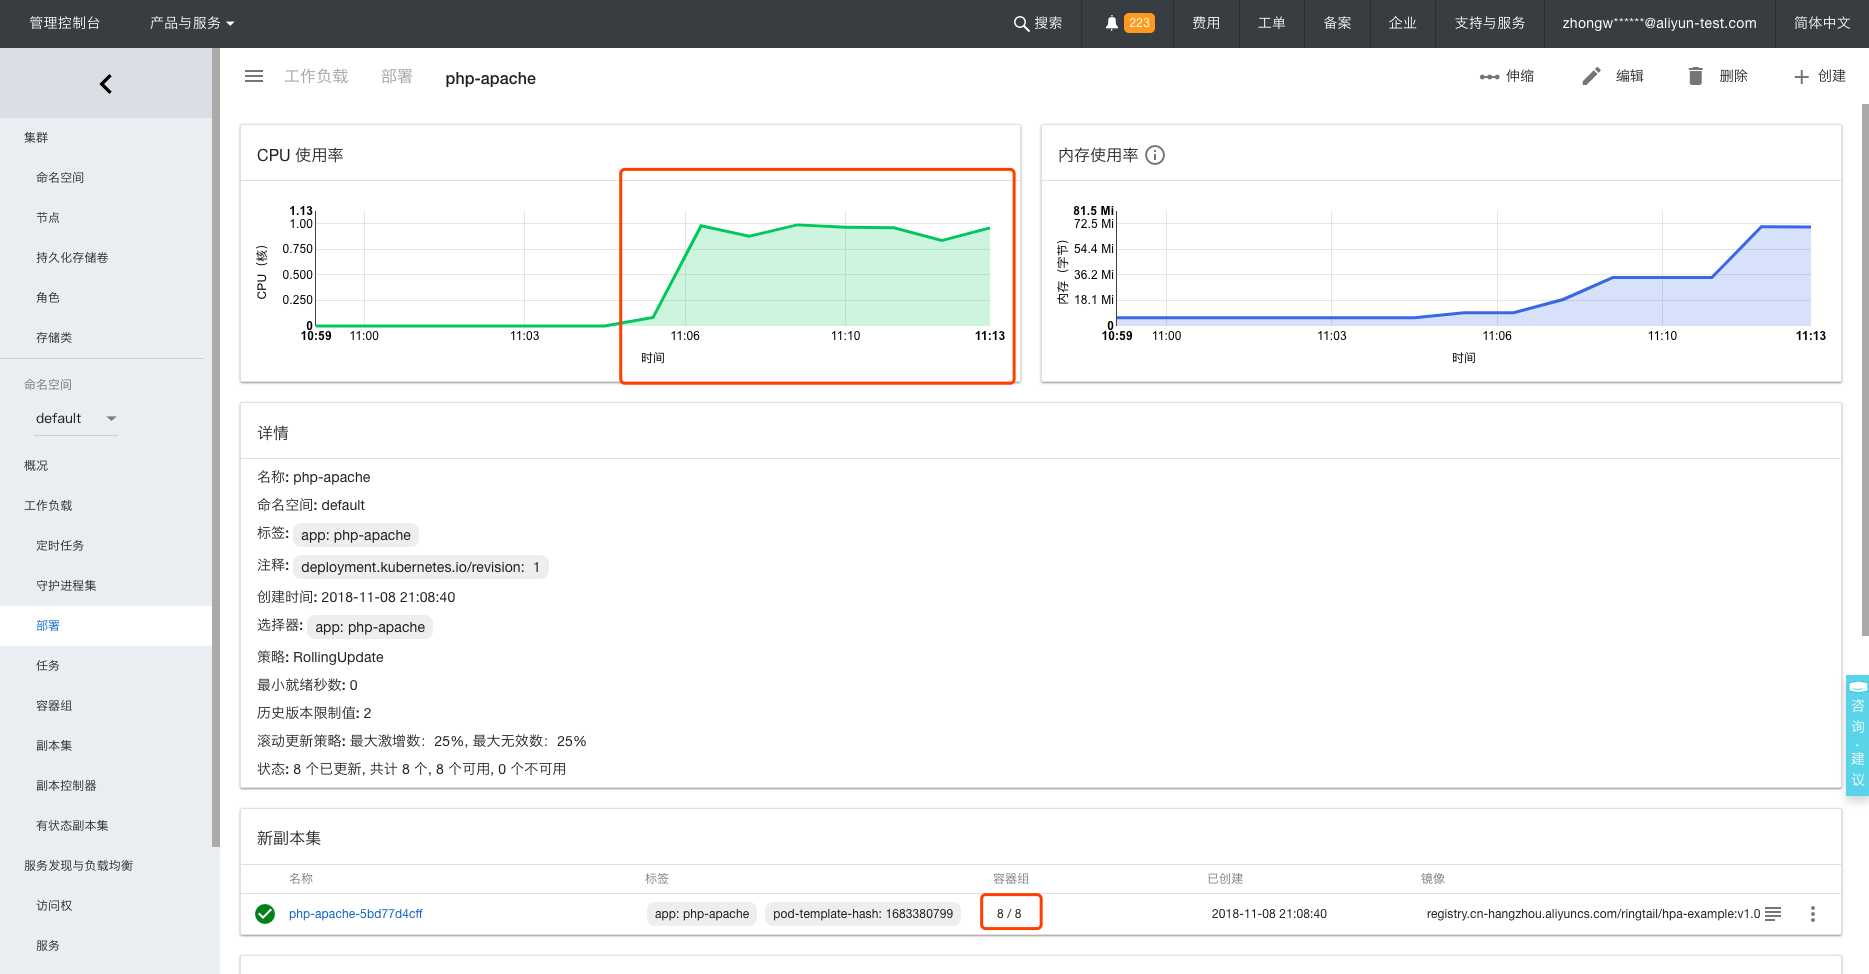
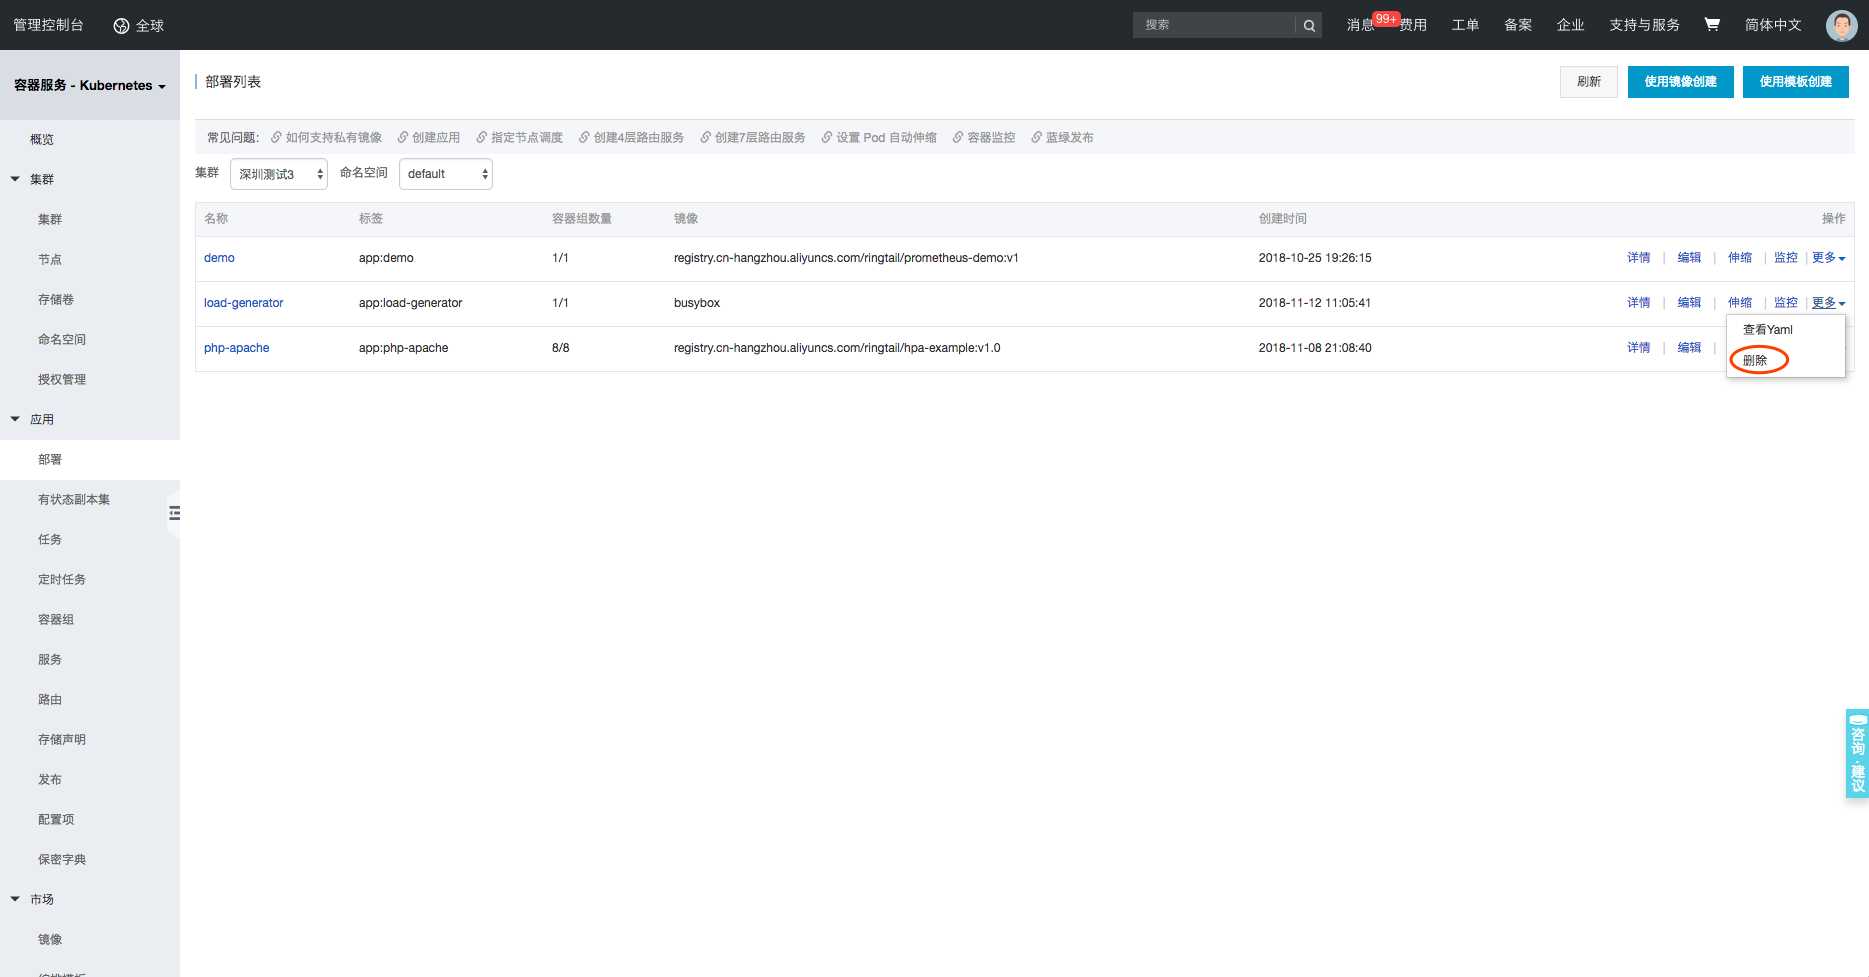
其中 scaleTargetRef 表示当前要操作的伸缩对象是谁。在本例中,伸缩的对象是一个 apps/v1 版本的 Deployment。 targetCPUUtilizationPercentage 表示:当整体的资源利用率超过 50% 的时候,会进行扩容。接下来我们做一个简单的 Demo 来实践下。
apiVersion: apps/v1beta1
  kind: Deployment
  metadata:
name: php-apache
labels:
 app: php-apache
  spec:
replicas: 1
selector:
 matchLabels:
   app: php-apache
template:
 metadata:
   labels:
     app: php-apache
 spec:
   containers:
   - name: php-apache
     image: registry.cn-hangzhou.aliyuncs.com/ringtail/hpa-example:v1.0
     ports:
     - containerPort: 80
     resources:
       requests:
         memory: "300Mi"
         cpu: "250m"
  ---
  apiVersion: v1
  kind: Service
  metadata:
name: php-apache
labels:
 app: php-apache
  spec:
selector:
 app: php-apache
ports:
- protocol: TCP
 name: http
 port: 80
 targetPort: 80
type: ClusterIP
apiVersion: autoscaling/v1
kind: HorizontalPodAutoscaler
metadata:
name: php-apache
namespace: default
spec:
scaleTargetRef:
  apiVersion: apps/v1beta1
  kind: Deployment
  name: php-apache
minReplicas: 1
maxReplicas: 10
targetCPUUtilizationPercentage: 50
apiVersion: apps/v1beta1
   kind: Deployment
   metadata:
     name: load-generator
     labels:
       app: load-generator
   spec:
     replicas: 1
     selector:
       matchLabels:
         app: load-generator
     template:
       metadata:
         labels:
           app: load-generator
       spec:
         containers:
         - name: load-generator
           image: busybox
           command:
             - "sh"
             - "-c"
             - "while true; do wget -q -O- http://php-apache.default.svc.cluster.local; done"
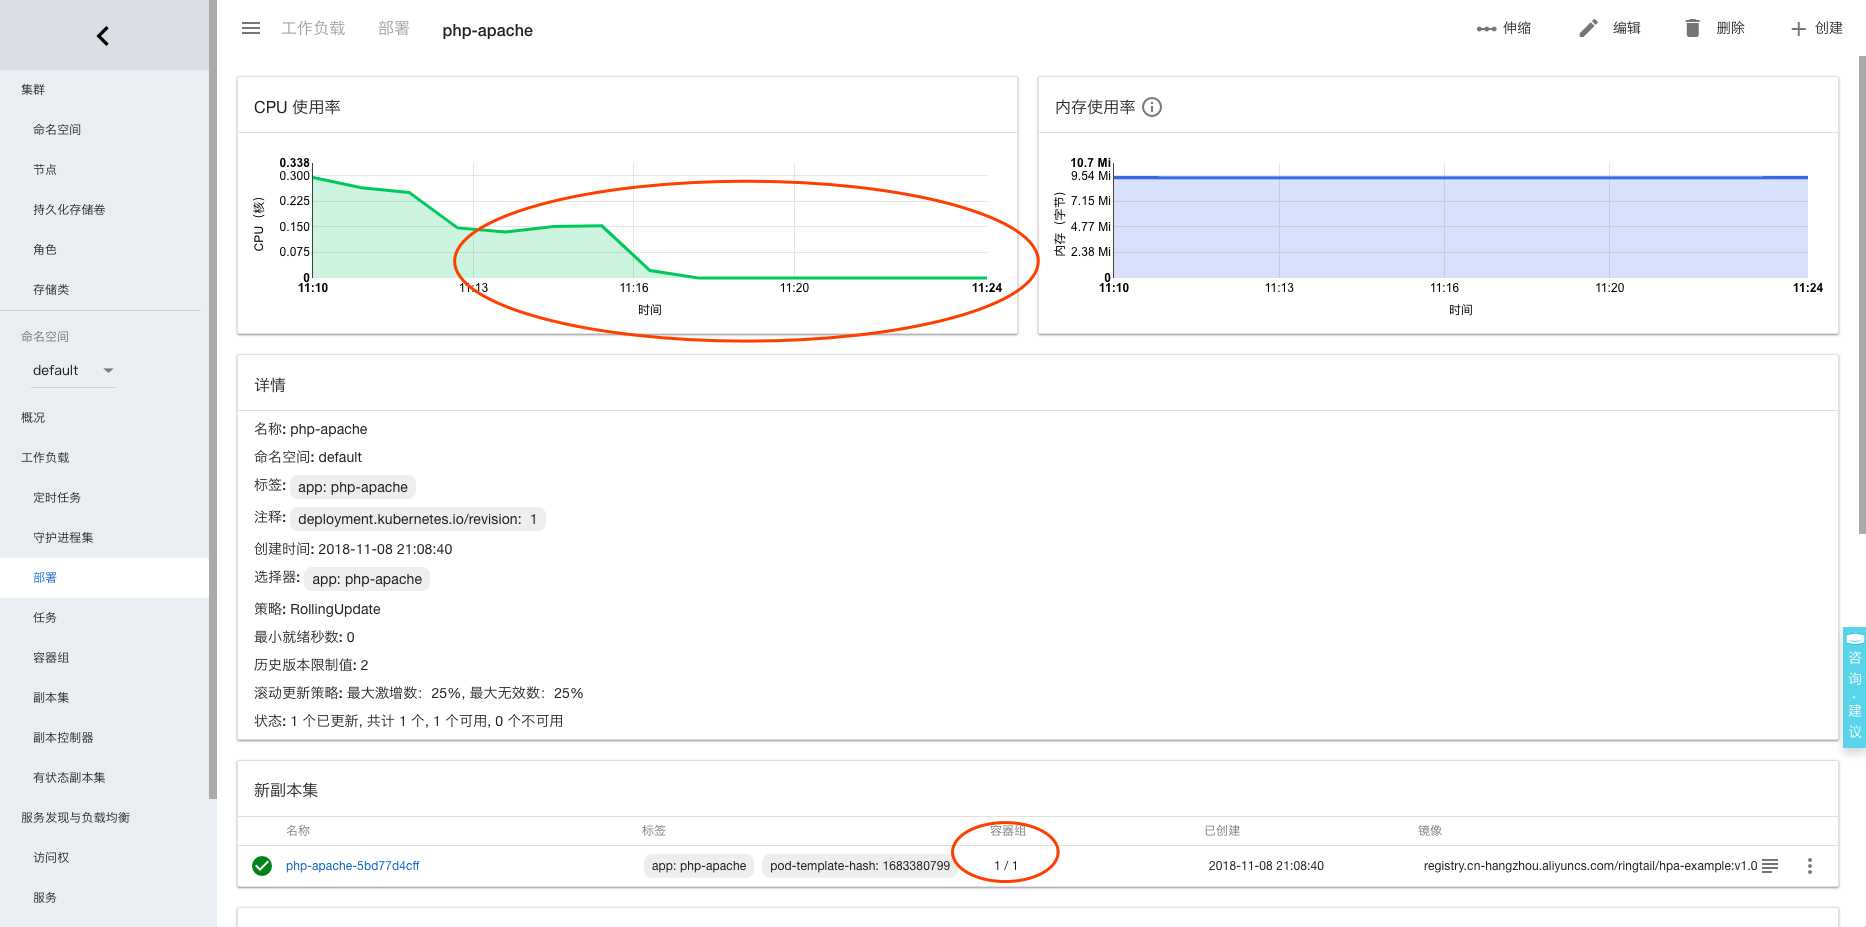
这样一个使用 autoscaling/v1 的 HPA 就完成了。相对而言,这个版本的 HPA 目前是最简单的,无论是否升级 Metrics-Server 都可以实现。
autoscaling/v2beta1 实践在前面的内容中为大家讲解了 HPA 还有 autoscaling/v2beta1 和 autoscaling/v2beta2 两个版本。这两个版本的区别是 autoscaling/v1beta1 支持了 Resource Metrics 和 Custom Metrics。而在 autoscaling/v2beta2 的版本中额外增加了 External Metrics 的支持。对于 External Metrics 在本文中就不进行过多赘述,因为 External Metrics 目前在社区里面没有太多成熟的实现,比较成熟的实现是 Prometheus Custom Metrics。
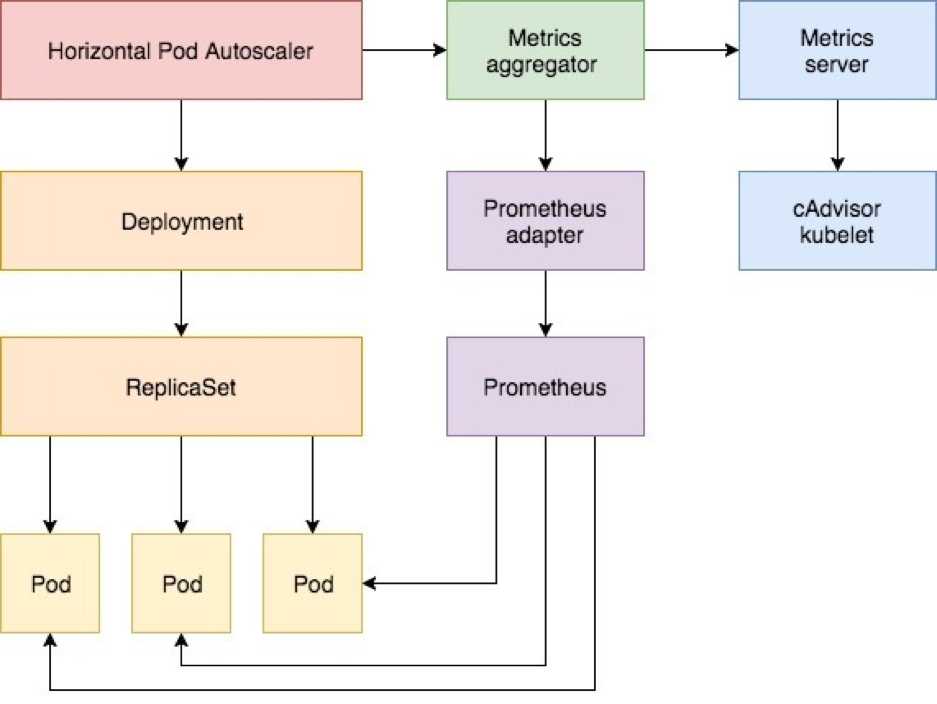
上面这张图为大家展现了开启 Metrics Server 后, HPA 如何使用不同类型的Metrics,如果需要使用 Custom Metrics ,则需要配置安装相应的 Custom Metrics Adapter。在下文中,主要为大家介绍一个基于 QPS 来进行弹性伸缩的例子。
Metrics Server 并在 kube-controller-manager 中进行开启
目前默认的阿里云容器服务 Kubernetes 集群使用还是 Heapster,容器服务计划在 1.12 中更新 Metrics Server,这个地方需要特别说明下,社区虽然已经逐渐开始废弃 Heapster,但是社区中还有大量的组件是在强依赖 Heapster 的 API,因此阿里云基于 Metrics Server 进行了 Heapster 完整的兼容,既可以让开发者使用 Metrics Server 的新功能,又可以无需担心其他组件的宕机。
在部署新的 Metrics Server 之前,我们首先要备份一下 Heapster 中的一些启动参数,因为这些参数稍后会直接用在 Metrics Server 的模板中。其中重点关心的是两个 Sink,如果需要使用 Influxdb 的开发者,可以保留第一个 Sink;如果需要保留云监控集成能力的开发者,则保留第二个 Sink。
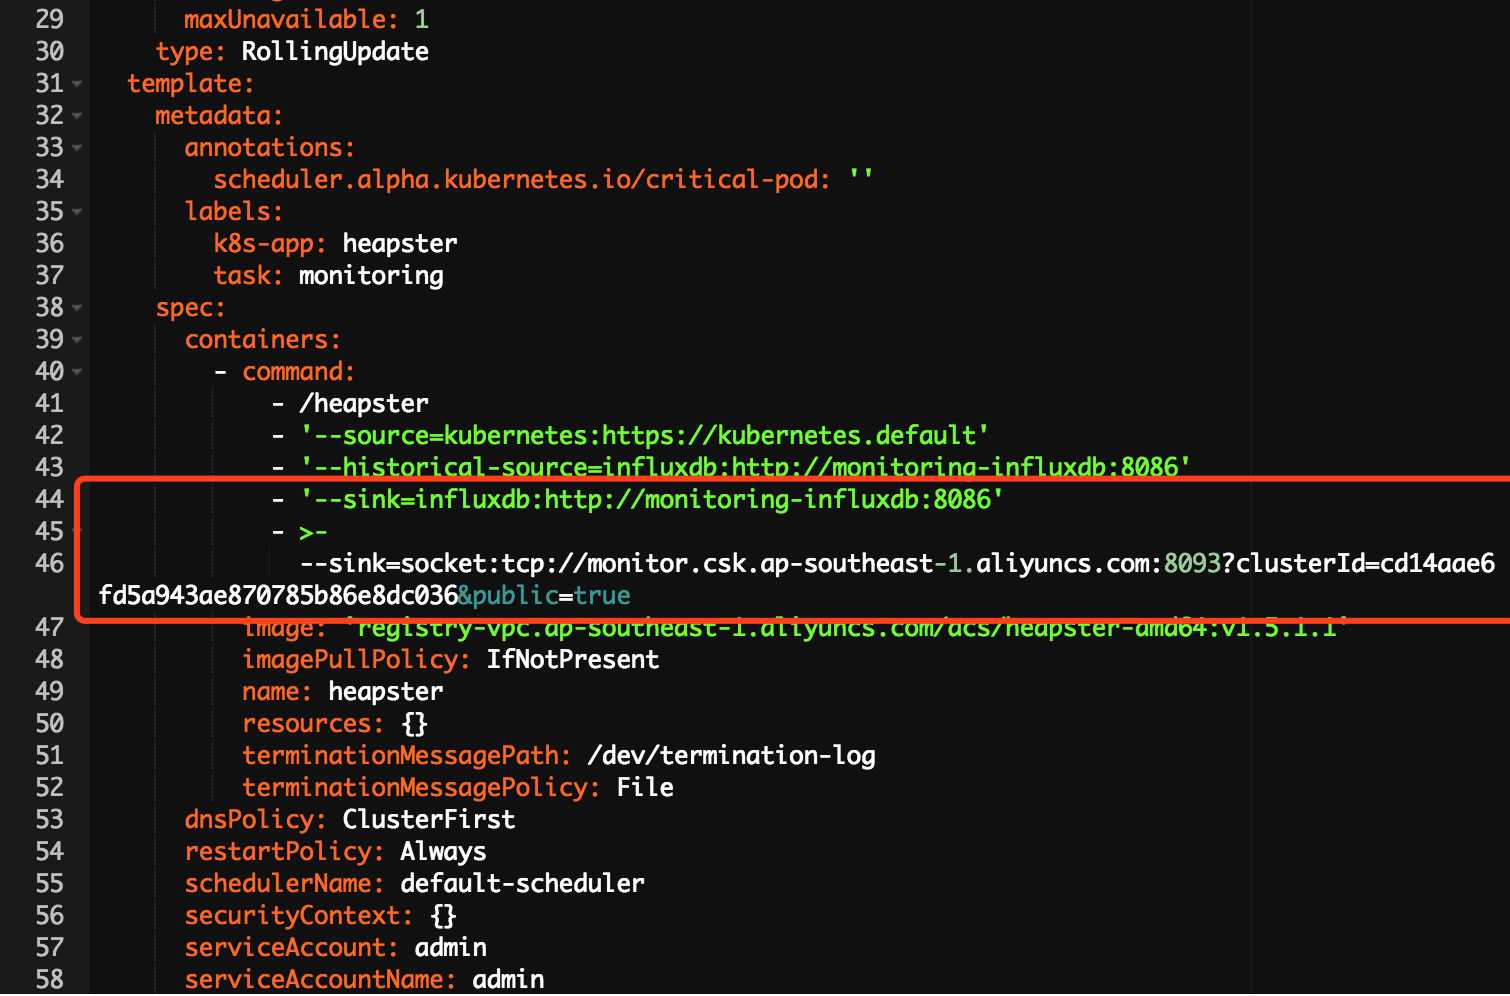
将这两个参数拷贝到 Metrics Server 的启动模板中,在本例中是两个都兼容,并下发部署。
apiVersion: v1
kind: ServiceAccount
metadata:
  name: metrics-server
  namespace: kube-system
---
apiVersion: v1
kind: Service
metadata:
  name: metrics-server
  namespace: kube-system
  labels:
    kubernetes.io/name: "Metrics-server"
spec:
  selector:
    k8s-app: metrics-server
  ports:
  - port: 443
    protocol: TCP
    targetPort: 443
---
apiVersion: apiregistration.k8s.io/v1beta1
kind: APIService
metadata:
  name: v1beta1.metrics.k8s.io
spec:
  service:
    name: metrics-server
    namespace: kube-system
  group: metrics.k8s.io
  version: v1beta1
  insecureSkipTLSVerify: true
  groupPriorityMinimum: 100
  versionPriority: 100
---
apiVersion: extensions/v1beta1
kind: Deployment
metadata:
  name: metrics-server
  namespace: kube-system
  labels:
    k8s-app: metrics-server
spec:
  selector:
    matchLabels:
      k8s-app: metrics-server
  template:
    metadata:
      name: metrics-server
      labels:
        k8s-app: metrics-server
    spec:
      serviceAccountName: admin
      containers:
      - name: metrics-server
        image: registry.cn-hangzhou.aliyuncs.com/ringtail/metrics-server:1.1
        imagePullPolicy: Always
        command:
        - /metrics-server
        - ‘--source=kubernetes:https://kubernetes.default‘
        - ‘--sink=influxdb:http://monitoring-influxdb:8086‘
        - ‘--sink=socket:tcp://monitor.csk.[region_id].aliyuncs.com:8093?clusterId=[cluster_id]&public=true‘
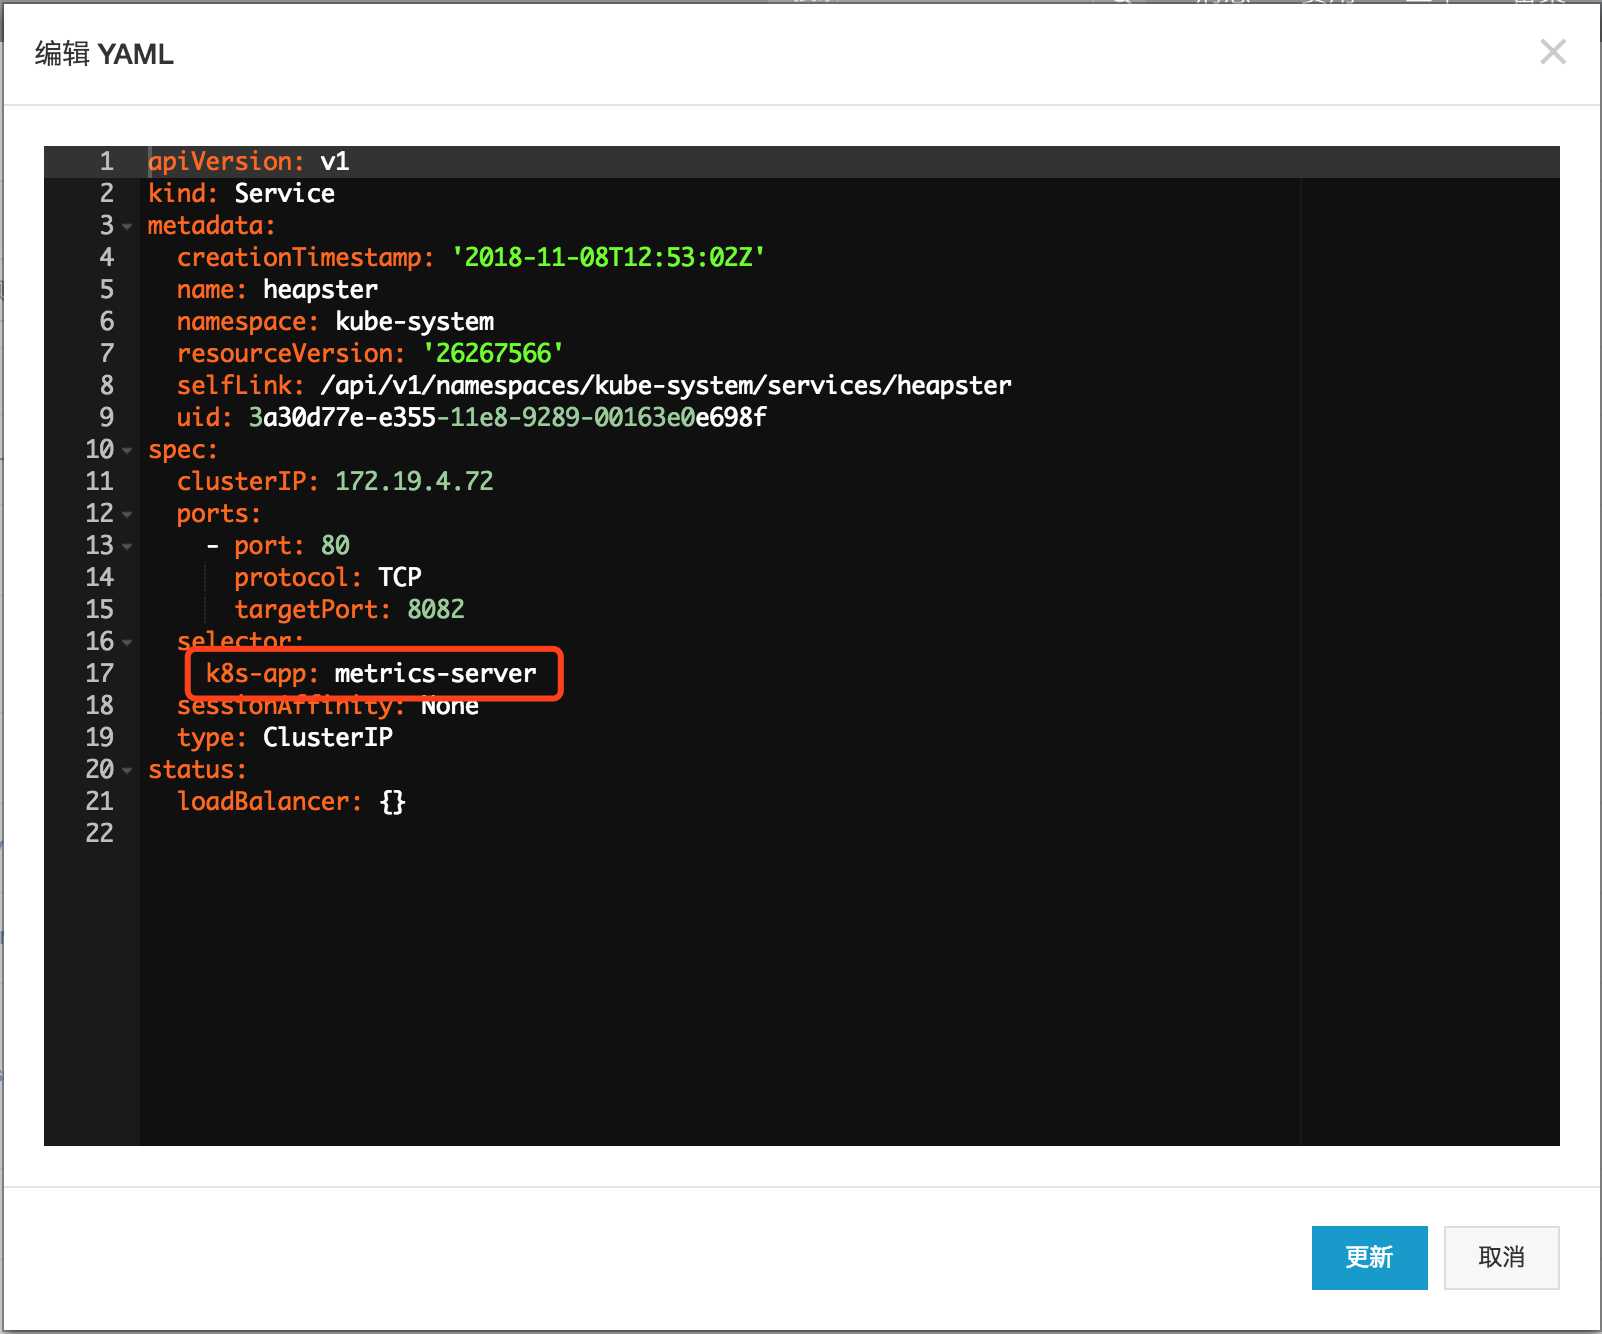
接下来我们修改下 Heapster 的 Service,将服务的后端从 Heapster 转移到 Metrics Server。
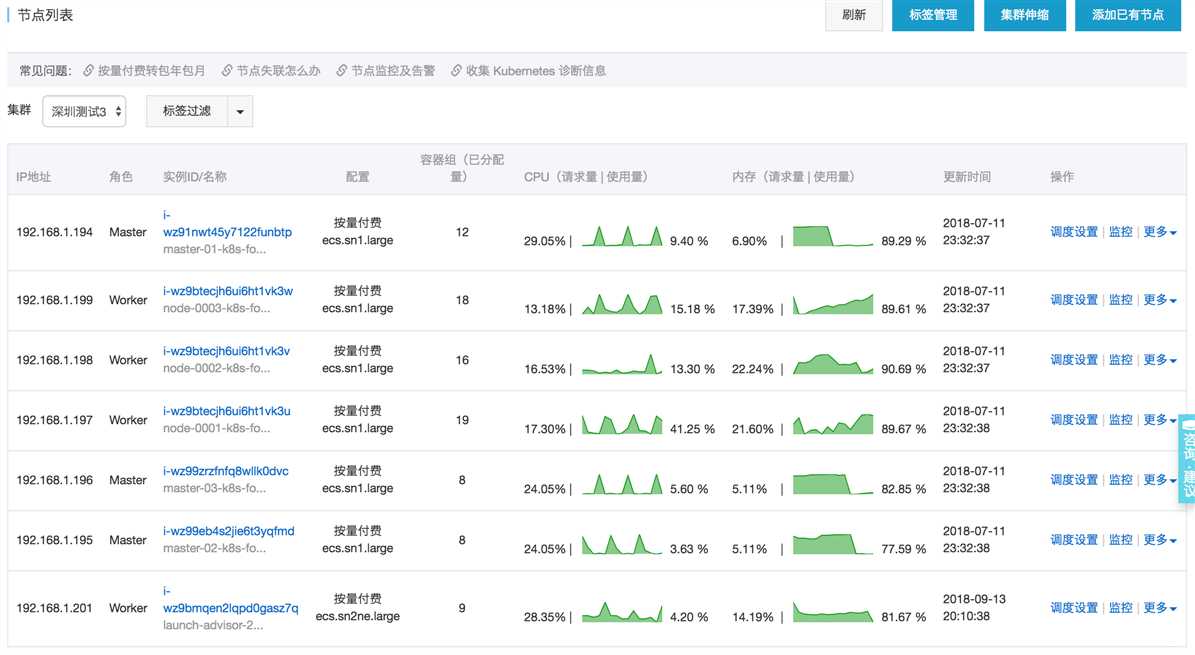
如果此时从控制台的节点页面可以获取到右侧的监控信息的话,说明 Metrics Server 已经完全兼容 Heapster。
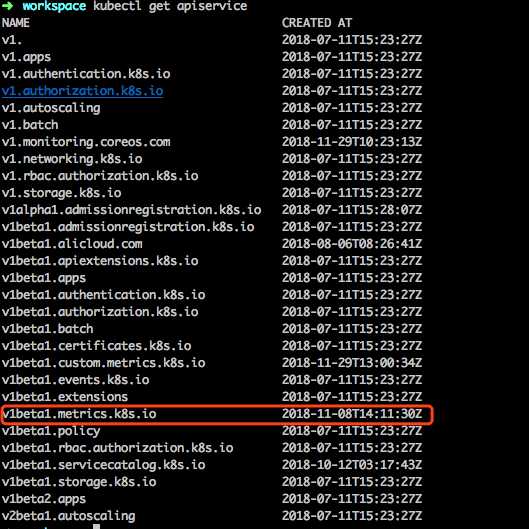
此时通过 kubectl get apiservice,如果可以看到注册的 v1beta1.metrics.k8s.io 的 api,则说明已经注册成功。
接下来我们需要在 kube-controller-manager 上切换 Metrics 的数据来源。kube-controller-manger 部署在每个 master 上,是通过 Static Pod 的托管给 kubelet 的。因此只需要修改 kube-controller-manager 的配置文件,kubelet 就会自动进行更新。kube-controller-manager 在主机上的路径是 /etc/kubernetes/manifests/kube-controller-manager.yaml。
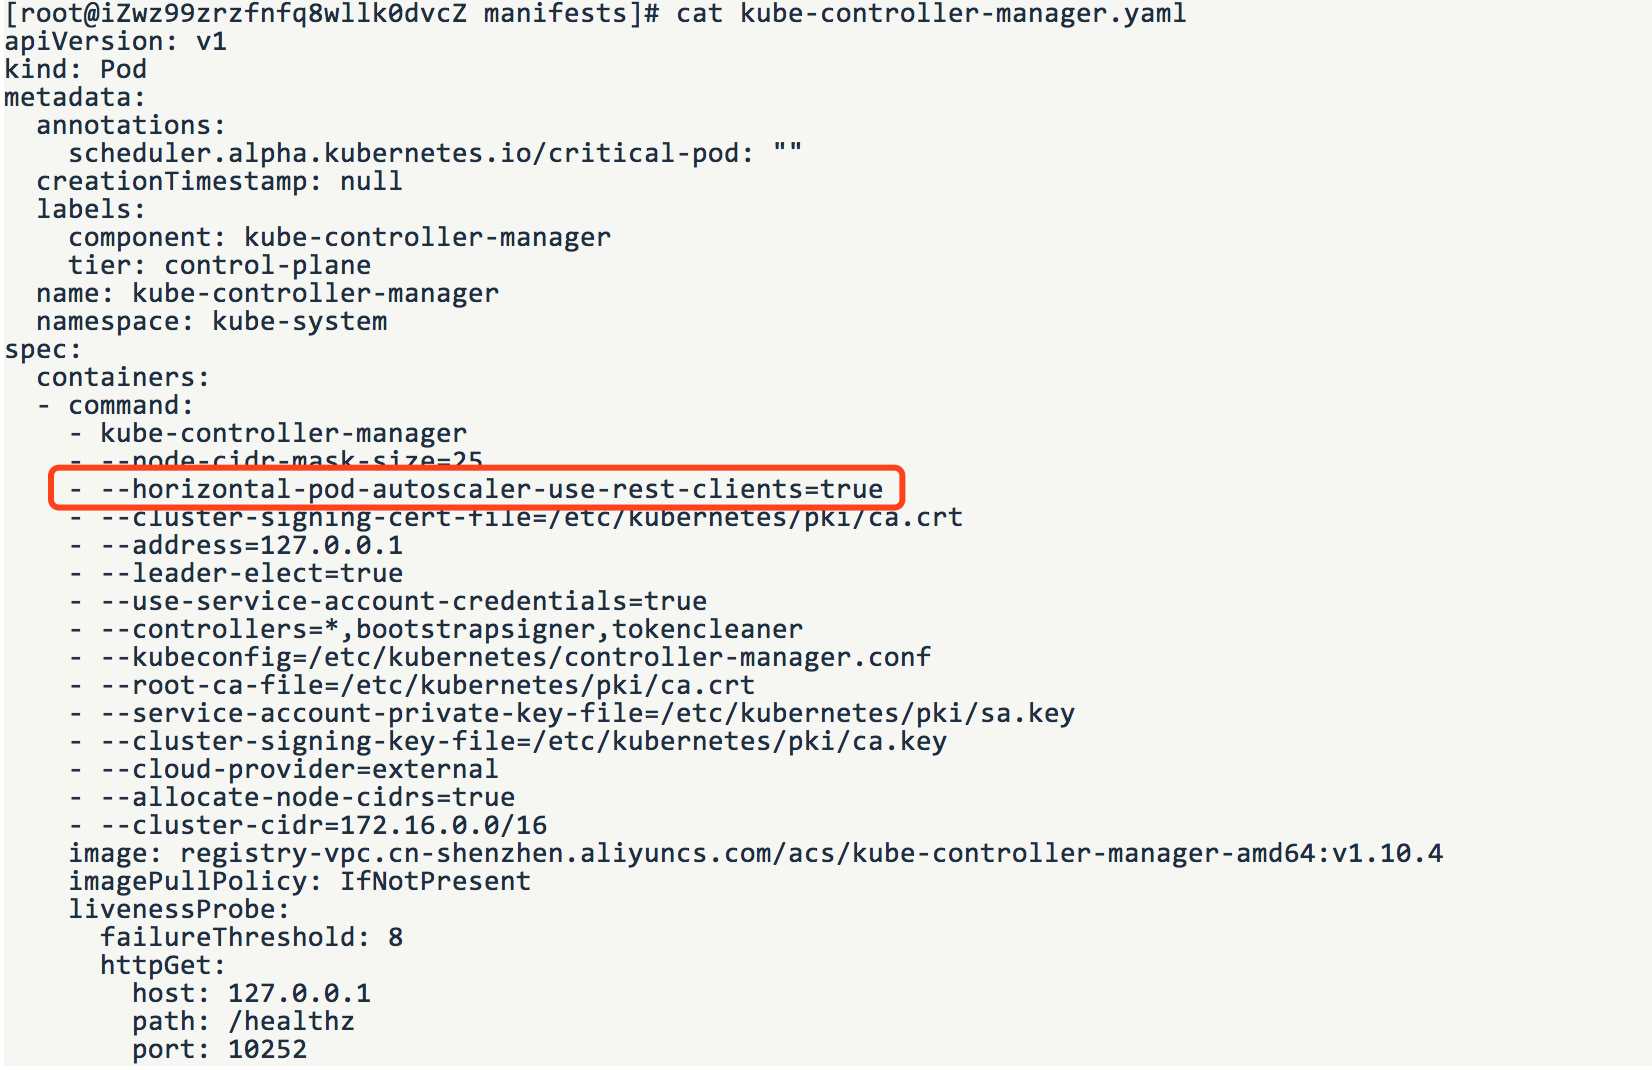
需要将 --horizontal-pod-autoscaler-use-rest-clients=true,这里有一个注意点,因为如果使用 vim 进行编辑,vim 会自动生成一个缓存文件影响最终的结果,所以比较建议的方式是将这个配置文件移动到其他的目录下进行修改,然后再移回原来的目录。至此,Metrics Server 已经可以为 HPA 进行服务了,接下来我们来做自定义指标的部分。
Custom Metrics Adapter
如集群中未部署 Prometheus,可以参考《阿里云容器Kubernetes监控(七) - Prometheus监控方案部署》先部署 Prometheus。接下来我们部署 Custom Metrics Adapter。
kind: Namespace
apiVersion: v1
metadata:
  name: custom-metrics
---
kind: ServiceAccount
apiVersion: v1
metadata:
  name: custom-metrics-apiserver
  namespace: custom-metrics
---
apiVersion: rbac.authorization.k8s.io/v1
kind: ClusterRoleBinding
metadata:
  name: custom-metrics:system:auth-delegator
roleRef:
  apiGroup: rbac.authorization.k8s.io
  kind: ClusterRole
  name: system:auth-delegator
subjects:
- kind: ServiceAccount
  name: custom-metrics-apiserver
  namespace: custom-metrics
---
apiVersion: rbac.authorization.k8s.io/v1
kind: RoleBinding
metadata:
  name: custom-metrics-auth-reader
  namespace: kube-system
roleRef:
  apiGroup: rbac.authorization.k8s.io
  kind: Role
  name: extension-apiserver-authentication-reader
subjects:
- kind: ServiceAccount
  name: custom-metrics-apiserver
  namespace: custom-metrics
---
apiVersion: rbac.authorization.k8s.io/v1
kind: ClusterRole
metadata:
  name: custom-metrics-resource-reader
rules:
- apiGroups:
  - ""
  resources:
  - namespaces
  - pods
  - services
  verbs:
  - get
  - list
---
apiVersion: rbac.authorization.k8s.io/v1
kind: ClusterRoleBinding
metadata:
  name: custom-metrics-apiserver-resource-reader
roleRef:
  apiGroup: rbac.authorization.k8s.io
  kind: ClusterRole
  name: custom-metrics-resource-reader
subjects:
- kind: ServiceAccount
  name: custom-metrics-apiserver
  namespace: custom-metrics
---
apiVersion: rbac.authorization.k8s.io/v1
kind: ClusterRole
metadata:
  name: custom-metrics-getter
rules:
- apiGroups:
  - custom.metrics.k8s.io
  resources:
  - "*"
  verbs:
  - "*"
---
apiVersion: rbac.authorization.k8s.io/v1
kind: ClusterRoleBinding
metadata:
  name: hpa-custom-metrics-getter
roleRef:
  apiGroup: rbac.authorization.k8s.io
  kind: ClusterRole
  name: custom-metrics-getter
subjects:
- kind: ServiceAccount
  name: horizontal-pod-autoscaler
  namespace: kube-system
---
apiVersion: apps/v1
kind: Deployment
metadata:
  name: custom-metrics-apiserver
  namespace: custom-metrics
  labels:
    app: custom-metrics-apiserver
spec:
  replicas: 1
  selector:
    matchLabels:
      app: custom-metrics-apiserver
  template:
    metadata:
      labels:
        app: custom-metrics-apiserver
    spec:
      tolerations:
      - key: beta.kubernetes.io/arch
        value: arm
        effect: NoSchedule
      - key: beta.kubernetes.io/arch
        value: arm64
        effect: NoSchedule
      serviceAccountName: custom-metrics-apiserver
      containers:
      - name: custom-metrics-server
        image: luxas/k8s-prometheus-adapter:v0.2.0-beta.0
        args:
        - --prometheus-url=http://prometheus-k8s.monitoring.svc:9090
        - --metrics-relist-interval=30s
        - --rate-interval=60s
        - --v=10
        - --logtostderr=true
        ports:
        - containerPort: 443
        securityContext:
          runAsUser: 0
---
apiVersion: v1
kind: Service
metadata:
  name: api
  namespace: custom-metrics
spec:
  ports:
  - port: 443
    targetPort: 443
  selector:
    app: custom-metrics-apiserver
---
apiVersion: apiregistration.k8s.io/v1
kind: APIService
metadata:
  name: v1beta1.custom.metrics.k8s.io
spec:
  insecureSkipTLSVerify: true
  group: custom.metrics.k8s.io
  groupPriorityMinimum: 1000
  versionPriority: 5
  service:
    name: api
    namespace: custom-metrics
  version: v1beta1
---
apiVersion: rbac.authorization.k8s.io/v1
kind: ClusterRole
metadata:
  name: custom-metrics-server-resources
rules:
- apiGroups:
  - custom-metrics.metrics.k8s.io
  resources: ["*"]
  verbs: ["*"]
---
apiVersion: rbac.authorization.k8s.io/v1
kind: ClusterRoleBinding
metadata:
  name: hpa-controller-custom-metrics
roleRef:
  apiGroup: rbac.authorization.k8s.io
  kind: ClusterRole
  name: custom-metrics-server-resources
subjects:
- kind: ServiceAccount
  name: horizontal-pod-autoscaler
  namespace: kube-system
apiVersion: apps/v1
kind: Deployment
metadata:
  labels:
    app: sample-metrics-app
  name: sample-metrics-app
spec:
  replicas: 2
  selector:
    matchLabels:
      app: sample-metrics-app
  template:
    metadata:
      labels:
        app: sample-metrics-app
    spec:
      tolerations:
      - key: beta.kubernetes.io/arch
        value: arm
        effect: NoSchedule
      - key: beta.kubernetes.io/arch
        value: arm64
        effect: NoSchedule
      - key: node.alpha.kubernetes.io/unreachable
        operator: Exists
        effect: NoExecute
        tolerationSeconds: 0
      - key: node.alpha.kubernetes.io/notReady
        operator: Exists
        effect: NoExecute
        tolerationSeconds: 0
      containers:
      - image: luxas/autoscale-demo:v0.1.2
        name: sample-metrics-app
        ports:
        - name: web
          containerPort: 8080
        readinessProbe:
          httpGet:
            path: /
            port: 8080
          initialDelaySeconds: 3
          periodSeconds: 5
        livenessProbe:
          httpGet:
            path: /
            port: 8080
          initialDelaySeconds: 3
          periodSeconds: 5
---
apiVersion: v1
kind: Service
metadata:
  name: sample-metrics-app
  labels:
    app: sample-metrics-app
spec:
  ports:
  - name: web
    port: 80
    targetPort: 8080
  selector:
    app: sample-metrics-app
---
apiVersion: monitoring.coreos.com/v1
kind: ServiceMonitor
metadata:
  name: sample-metrics-app
  labels:
    service-monitor: sample-metrics-app
spec:
  selector:
    matchLabels:
      app: sample-metrics-app
  endpoints:
  - port: web
---
kind: HorizontalPodAutoscaler
apiVersion: autoscaling/v2beta1
metadata:
  name: sample-metrics-app-hpa
spec:
  scaleTargetRef:
    apiVersion: apps/v1
    kind: Deployment
    name: sample-metrics-app
  minReplicas: 2
  maxReplicas: 10
  metrics:
  - type: Object
    object:
      target:
        kind: Service
        name: sample-metrics-app
      metricName: http_requests
      targetValue: 100
---
apiVersion: extensions/v1beta1
kind: Ingress
metadata:
  name: sample-metrics-app
  namespace: default
  annotations:
    traefik.frontend.rule.type: PathPrefixStrip
spec:
  rules:
  - http:
      paths:
      - path: /sample-app
        backend:
          serviceName: sample-metrics-app
          servicePort: 80
这个压测的应用暴露了一个 Prometheus 的接口。接口中的数据如下,其中 http_requests_total 这个指标就是我们接下来伸缩使用的自定义指标。
[root@iZwz99zrzfnfq8wllk0dvcZ manifests]# curl 172.16.1.160:8080/metrics
# HELP http_requests_total The amount of requests served by the server in total
# TYPE http_requests_total counter
http_requests_total 3955684
apiVersion: apps/v1beta1
kind: Deployment
metadata:
  name: load-generator
  labels:
    app: load-generator
spec:
  replicas: 1
  selector:
    matchLabels:
      app: load-generator
  template:
    metadata:
      labels:
        app: load-generator
    spec:
      containers:
      - name: load-generator
        image: busybox
        command:
          - "sh"
          - "-c"
          - "while true; do wget -q -O- http://sample-metrics-app.default.svc.cluster.local; done"
workspace kubectl get hpa
NAME                     REFERENCE                       TARGETS       MINPODS   MAXPODS   REPLICAS   AGE
php-apache               Deployment/php-apache           0%/50%        1         10        1          21d
sample-metrics-app-hpa   Deployment/sample-metrics-app   538133m/100   2         10        10         15h
这篇文章主要是给大家带来一个对于 autoscaling/v1 和 autoscaling/v2beta1 的感性认知和大体的操作方式,对于 autoscaling/v1 我们不做过多的赘述,对于希望使用支持 Custom Metrics 的 autoscaling/v2beta1 的开发者而言,也许会认为整体的操作流程过于复杂难以理解,我们会在下一篇文章中为大家详解 autoscaling/v2beta1 使用 Custom Metrics 的种种细节,帮助大家更深入地理解其中的原理与设计思路。
Kubernetes 弹性伸缩全场景解析(三) - HPA 实践手册
标签:container socket 组件 let key osc policy 相对 基于
原文地址:https://www.cnblogs.com/alisystemsoftware/p/11286988.html