标签:线性 span 测量 重复 模型 report pre mic print
1.本节重点知识点用自己的话总结出来,可以配上图片,以及说明该知识点的重要性
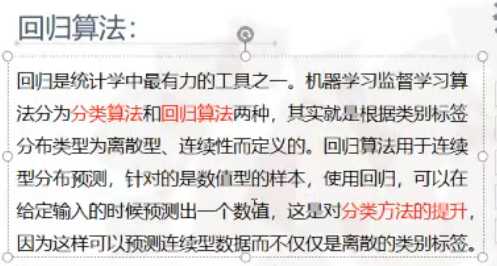
(1)什么是线性回归算法
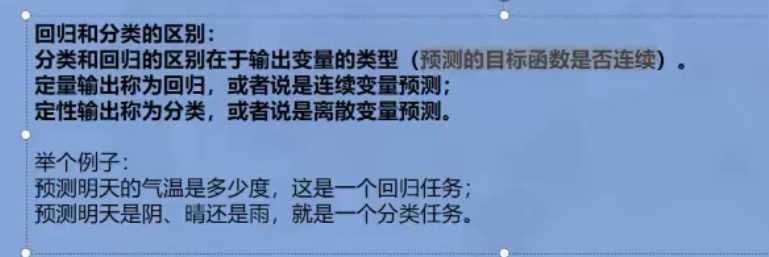
(2)回归和分类的区别
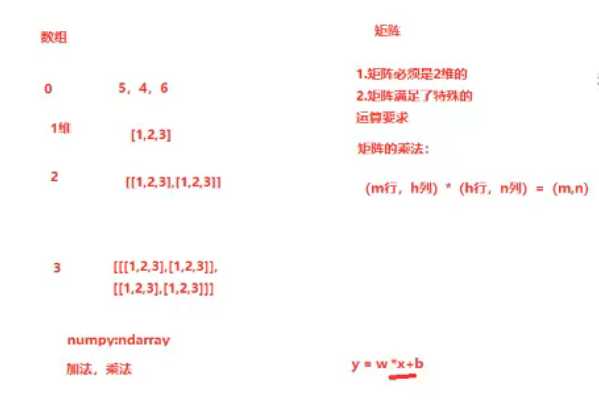
(3)线性回归问题可以转换为矩阵乘积问题。
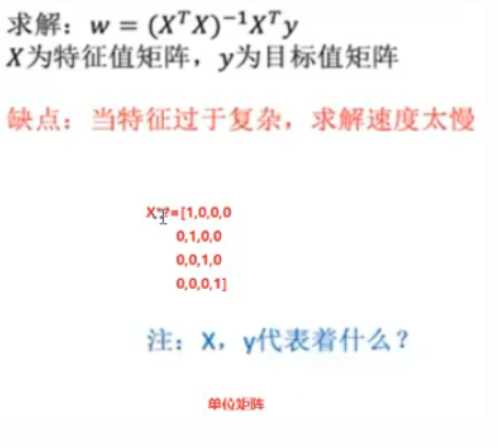
正规方程:
梯度下降法:
梯度下降简单来说是一种基于搜索的最优化方法。很多算法都没有闭式解的,所以需要通过一次一次的迭代来找到找到一组参数能让我们的损失函数最小,越小说明越准确。
2.思考线性回归算法可以用来做什么?(大家尽量不要写重复)
(1)电影票房的预测
(2)双色球预测中奖号码
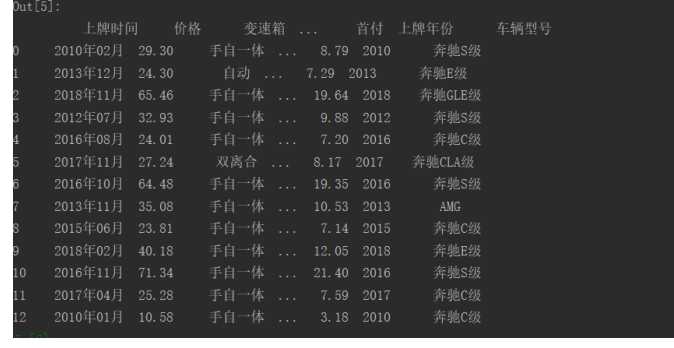
(3)二手车价格和上牌年份、表现里程的预测
3.自主编写线性回归算法 ,数据可以自己造,或者从网上获取。(加分题)
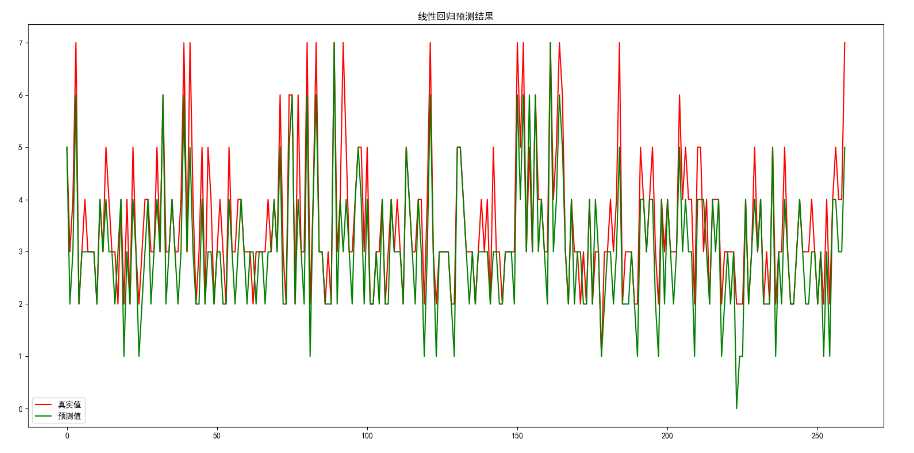
二手车价格预测:
代码:
def dealdata(test_data, data):
    test_data[‘车辆型号‘] = data[‘车辆型号‘]
    test_data[‘表显里程‘] = data[‘表显里程‘].astype(‘float‘)
    test_data[‘排量‘] = data[‘排量‘].astype(‘float‘)
    test_data[‘上牌年份‘] = data[‘上牌年份‘].astype(‘float‘)
    # 变速箱分类
    floor_class = list(data[‘变速箱‘].unique())
    for i in range(len(data)):
        floor = data.loc[i, ‘变速箱‘]
        floor_index = floor_class.index(floor) + 1
        test_data.loc[i, ‘变速箱‘] = floor_index

test_data = pd.DataFrame()
dealdata(test_data, data)
test_data = pd.concat([test_data, pd.get_dummies(test_data[‘车辆型号‘])], axis=1)
del test_data[‘车辆型号‘]
test_data
x = test_data.drop(‘价格‘, axis=1)
y = test_data[‘价格‘]
# 价格分类
sumprice_list = data[‘价格‘].astype(int)
for i in range(len(sumprice_list)):
    if sumprice_list[i] < 10:
        test_data.loc[i, ‘价格‘] = 1
    elif sumprice_list[i] >= 10 and sumprice_list[i] < 20:
        test_data.loc[i, ‘价格‘] = 2
    elif sumprice_list[i] >= 20 and sumprice_list[i] < 30:
        test_data.loc[i, ‘价格‘] = 3
    elif sumprice_list[i] >= 20 and sumprice_list[i] < 30:
        test_data.loc[i, ‘价格‘] = 3
    elif sumprice_list[i] >= 30 and sumprice_list[i] < 40:
        test_data.loc[i, ‘价格‘] = 4
    elif sumprice_list[i] >= 40 and sumprice_list[i] < 50:
        test_data.loc[i, ‘价格‘] = 5
    elif sumprice_list[i] >= 50 and sumprice_list[i] < 60:
        test_data.loc[i, ‘价格‘] = 6
    elif sumprice_list[i] >= 60 and sumprice_list[i] < 100:
        test_data.loc[i, ‘价格‘] = 7
test_data[‘价格‘] = test_data.loc[:, ‘价格‘].astype(int)

x_train, x_test, y_train, y_test = train_test_split(x.values, y.values, test_size=0.2)
linear = LinearRegression()  # 构建模型
linear.fit(x_train, y_train)  # 训练模型
pre = linear.predict(x_test).astype(int)
print(‘回归模型准确率:‘, linear.score(x_test, y_test))
print(‘分类报告\n‘, classification_report(y_test, pre))
# 可视化
plt.figure(figsize=(15, 5))
plt.plot(y_test, color="r", label="真实值")
plt.plot(pre, color="g", label="预测值")
plt.legend()
plt.title("线性回归预测结果")
标签:线性 span 测量 重复 模型 report pre mic print
原文地址:https://www.cnblogs.com/wh008/p/12753837.html