标签:lin line pch 添加 img rman max 包含 end
目的:根据水体面积数据分别绘制永久水体、季节性水体、总水体的折线图,并添加Theil-sen趋势线与regime shift折线
过程:
1、引用相关包,mblm包包含Theil-sen函数,可用来生成TS趋势线
library("mblm")
2、导入数据
year_theilsen<-read.csv("E:/数据/year_theilsen.csv")
x<-year_theilsen$year
y1 <- year_theilsen$p
y2 <- year_theilsen$s
y3 <- year_theilsen$m
y4 <- year_theilsen$p1
y5 <- year_theilsen$s1
y6 <- year_theilsen$m1
3、利用mblm生成趋势线
fit1<- mblm(y1~x)
fit2<- mblm(y2~x)
fit3<- mblm(y3~x)
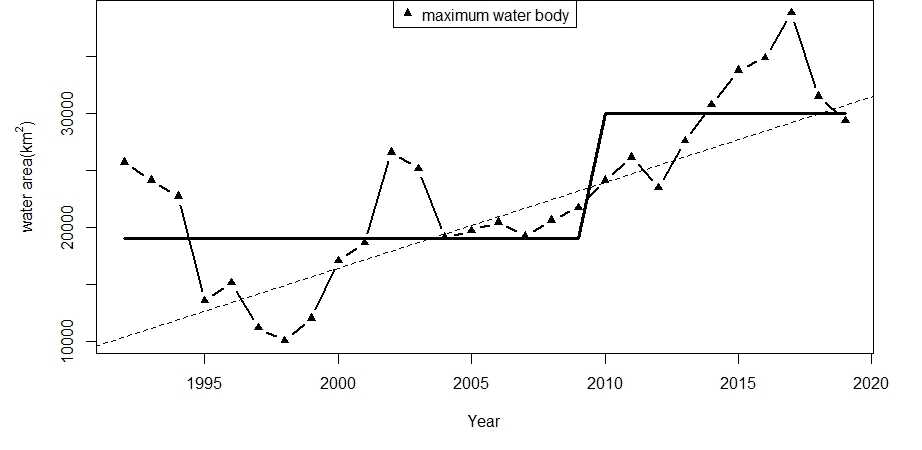
4、绘图
par(mai=c(0,1,0,0.5))#留出下,左,上,右的边界空间,起初未添加此行代码时,ylab的上标显示不全
plot(x,y1,type="b",lwd=2,pch=15,xlab = "Year",ylab = expression("w"*"a"*"t"*"e"*"r"~"a"*"r"*"e"*"a"*"("*"k"*m^2*")"))#绘制原始数据折线图
abline(fit,lty=2,lwd=1.5)#利用abline函数添加直线
abline(h=2443.94,lwd=3)
legend("top",pch=15,legend = "permanent water body")#添加标签

par(mai=c(0,1,0,0.5))#留出下,左,上,右的边界空间
plot(x,y2,type="b",lwd=2,pch=16,xlab = "Year",ylab = expression("w"*"a"*"t"*"e"*"r"~"a"*"r"*"e"*"a"*"("*"k"*m^2*")"))
abline(fit,lty=2,lwd=1.5)
lines(x,y5,lwd=3)#利用lines添加折线
legend("top",pch=16,legend = "seasonal water body")

par(mai=c(1,1,0,0.5))#留出下,左,上,右的边界空间
plot(x,y3,type="b",lwd=2,pch=17,xlab = "Year",ylab = expression("w"*"a"*"t"*"e"*"r"~"a"*"r"*"e"*"a"*"("*"k"*m^2*")"))
abline(fit,lty=2,lwd=1.5)
lines(x,y6,lwd=3)
legend("top",pch=17,legend = "maximum water body")
5、导出图像
标签:lin line pch 添加 img rman max 包含 end
原文地址:https://www.cnblogs.com/cjhckx1314/p/12812182.html