标签:存储 image centos6 mysqld img idt close log arch
Prometheus是一个开源的系统监控和警报工具包
相比其他监控系统,它更适用于微服务的体系架构
它使用各种专用exporter,用来实现对硬件/存储/数据库/web服务等的监控
说明:刘宏缔的架构森林是一个专注架构的博客,地址:https://www.cnblogs.com/architectforest
对应的源码可以访问这里获取: https://github.com/liuhongdi/
说明:作者:刘宏缔 邮箱: 371125307@qq.com
1,官网:
https://prometheus.io/
2,prometheus的软件下载地址
https://prometheus.io/download/
3,下载
下载到源代码目录下
[root@blog prometheus]# pwd
/usr/local/source/prometheus
[root@blog prometheus]# wget https://github.com/prometheus/prometheus/releases/download/v2.18.1/prometheus-2.18.1.linux-amd64.tar.gz
1,解压缩
[root@blog prometheus]# tar -zxvf prometheus-2.18.1.linux-amd64.tar.gz
2,移动到软件的安装目录
[root@blog prometheus]# mv prometheus-2.18.1.linux-amd64 /usr/local/soft/
查看配置文件
[root@blog prometheus-2.18.1.linux-amd64]# more prometheus.yml
内容
...
scrape_configs:
  - job_name: ‘prometheus‘
    static_configs:
    - targets: [‘localhost:9090‘]
因为默认的配置文件中已经有prometheus自身的信息配置,
所以无需修改
1,创建service文件
[root@blog ~]# vi /usr/lib/systemd/system/prometheus.service
内容:
[Unit]
Description=prometheus
After=network.target

[Service]
Type=simple
ExecStart=/usr/local/soft/prometheus-2.18.1.linux-amd64/prometheus --config.file="/usr/local/soft/prometheus-2.18.1.linux-amd64/prometheus.yml"
LimitNOFILE=65536
PrivateTmp=true
RestartSec=2
StartLimitInterval=0
Restart=always

[Install]
WantedBy=multi-user.target
说明:注意把软件的路径替换成自己prometheus安装的路径
2,重新加载服务列表
[root@blog ~]# systemctl daemon-reload
3,启动服务
[root@blog ~]# systemctl start prometheus.service
1,查看版本
[root@blog ~]# /usr/local/soft/prometheus-2.18.1.linux-amd64/prometheus --version
prometheus, version 2.18.1 (branch: HEAD, revision: ecee9c8abfd118f139014cb1b174b08db3f342cf)
  build user:       root@2117a9e64a7e
  build date:       20200507-16:51:47
  go version:       go1.14.2
2,查看帮助:
[root@blog ~]# /usr/local/soft/prometheus-2.18.1.linux-amd64/prometheus --help
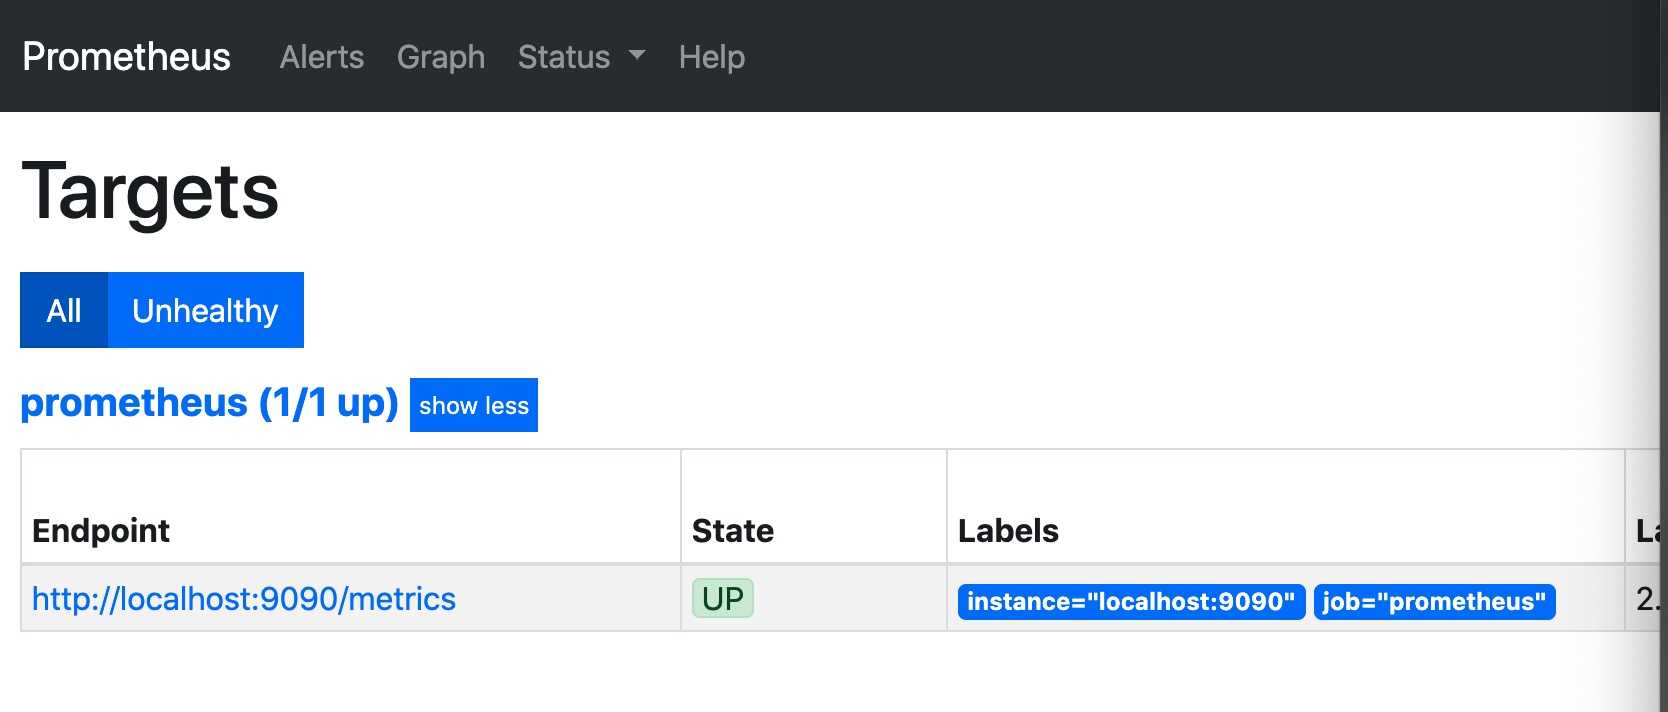
3,登录到图形管理界面:
访问下面的地址:注意把ip替换成自己服务器的ip
http://121.122.123.47:9090/targets
查看截图:
1,常用的几个exporter
node_exporter: 监控操作系统的性能和运行状态
mysqld_exporter:监控 mysql 服务
snmp_exporter: 监控网络设备
这里以安装node_exporter为例:
2,下载node_exporter
[root@cacheServer prometheus]# pwd
/usr/local/source/prometheus
[root@cacheServer prometheus]# wget https://github.com/prometheus/node_exporter/releases/download/v1.0.0/node_exporter-1.0.0.linux-amd64.tar.gz
3,安装node_exporter:
解压缩
[root@cacheServer prometheus]# tar -zxvf node_exporter-1.0.0.linux-amd64.tar.gz
移动到安装目录
[root@cacheServer prometheus]# mv node_exporter-1.0.0.linux-amd64 /usr/local/soft/
查看node_exporter的版本:
[root@cacheServer ~]# /usr/local/soft/node_exporter-1.0.0.linux-amd64/node_exporter --version
node_exporter, version 1.0.0 (branch: HEAD, revision: b9c96706a7425383902b6143d097cf6d7cfd1960)
  build user:       root@3e55cc20ccc0
  build date:       20200526-06:01:48
  go version:       go1.14.3
5,启动:
#nohup:忽略所有挂断(SIGHUP)信号
#&:把进程扔到后台执行
[root@cacheServer prometheus]# nohup /usr/local/soft/node_exporter-1.0.0.linux-amd64/node_exporter &
因为我用来安装客户端的这台机器OS版本是centos6.5,所以我们就不再编写service文件,
如果大家的客户端机器是centos7或centos8,可以参考这个内容:
[Unit]
Description=node_exporter
After=network.target

[Service]
Type=simple
ExecStart=/usr/local/soft/node_exporter-1.0.0.linux-amd64/node_exporter
PrivateTmp=true
RestartSec=5
StartLimitInterval=0
Restart=always

[Install]
WantedBy=multi-user.target
判断启动是否成功?
[root@cacheServer ~]# ss -lntp | grep 9100
LISTEN     0      128                       *:9100                     *:*      users:(("node_exporter",6440,3))
经检查可以发现node_exporter已经守护在了9100端口了
说明:服务端在获取客户端的数据之前,必须能访问客户端上的9100端口,
大家应该先用telnet测试能否访问,如果不能访问,
请先检查客户端防火墙是否放开了从服务端ip到客户端ip及端口的访问
例:
[root@blog ~]$ telnet 121.122.123.118 9100
Trying 121.122.123.118...
Connected to 121.122.123.118.
Escape character is ‘^]‘.
^]
telnet> quit
Connection closed.
编辑prometheus服务端的配置文件
[root@blog ~]# cd /usr/local/soft/prometheus-2.18.1.linux-amd64/
[root@blog prometheus-2.18.1.linux-amd64]# vi prometheus.yml
在下增加一段针对118这个node_exporter的job:注意把ip换成自己安装node_exporter客户端的ip
- job_name: ‘118node‘
  static_configs:
  - targets: [‘121.122.123.118:9100‘]
说明:添加到配置文件中时要注意缩进
编辑完成后重启服务
[root@blog ~]# systemctl restart prometheus.service
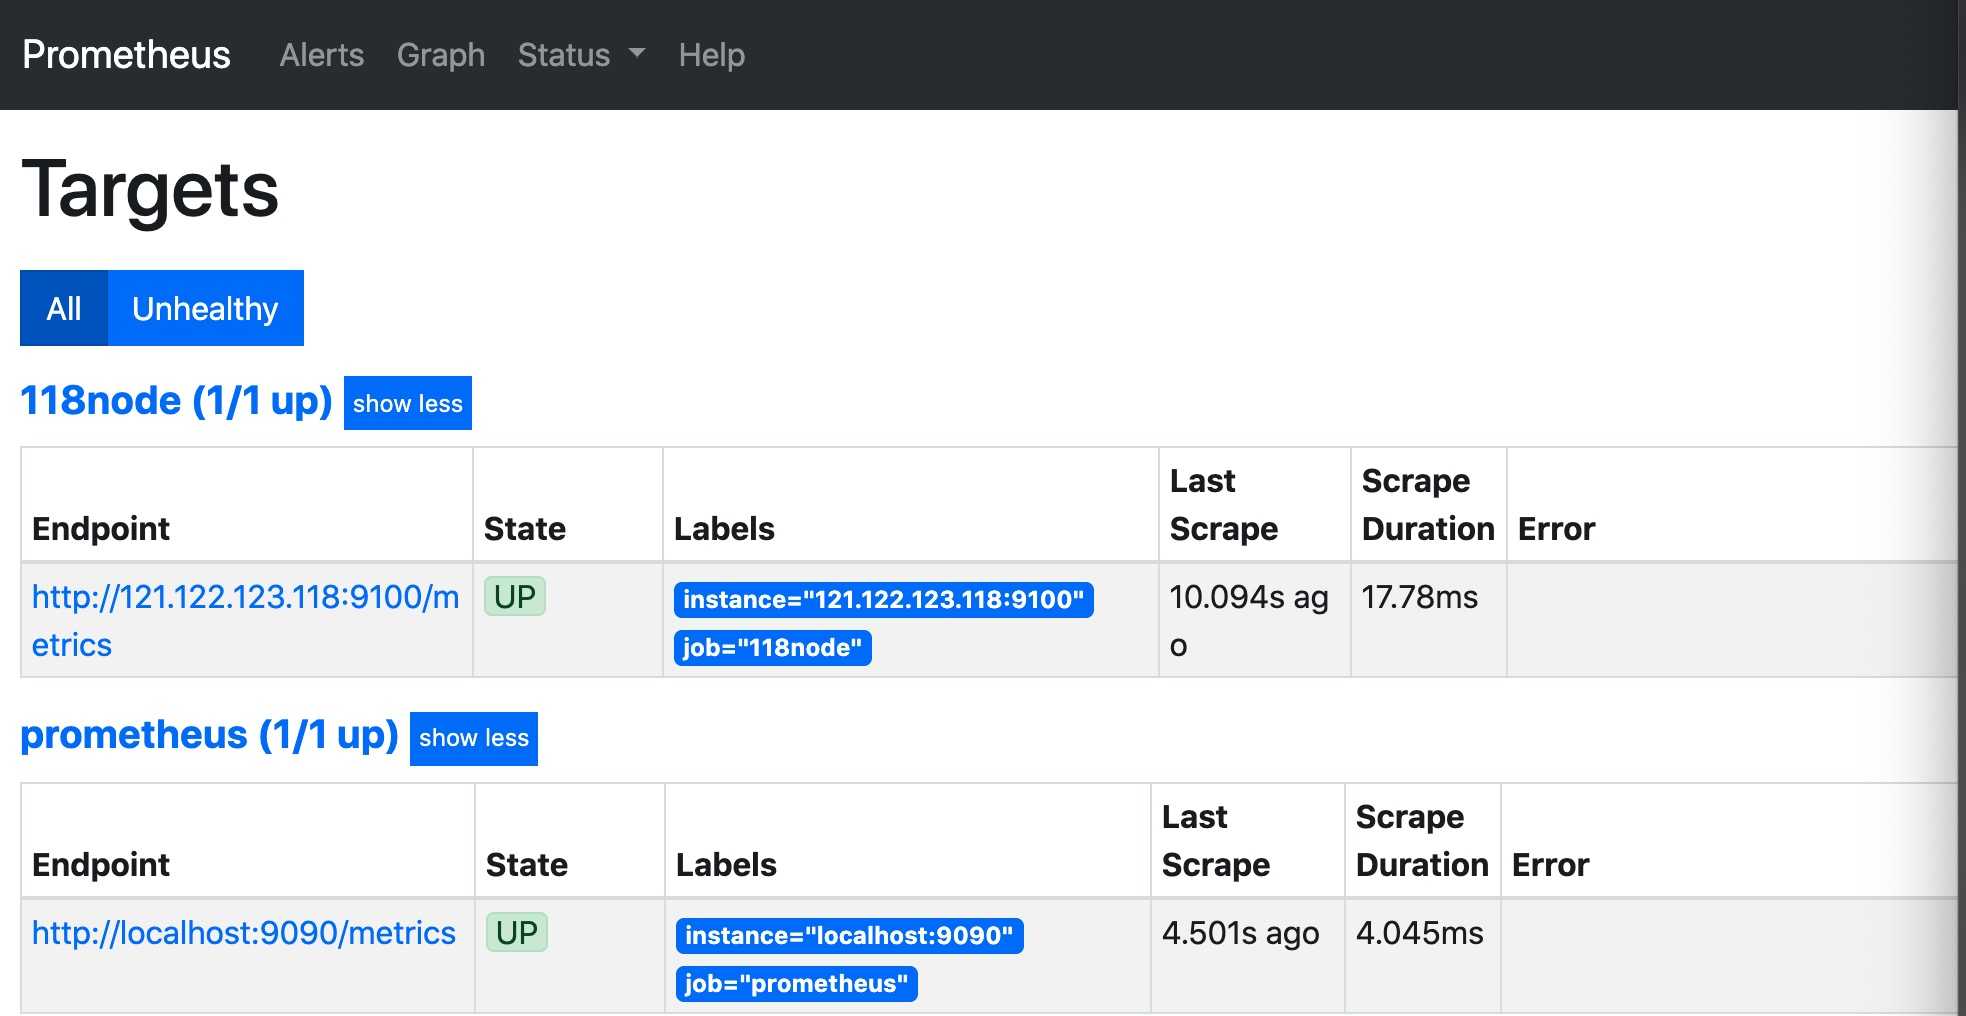
登录页面查看效果:注意把ip换成自己的服务器ip
http://121.122.123.47:9090/targets
效果如图:
[root@blog ~]# cat /etc/redhat-release
CentOS Linux release 8.0.1905 (Core)
linux(centos8):安装prometheus服务端/node_exporter客户端(prometheus 2.18.1)
标签:存储 image centos6 mysqld img idt close log arch
原文地址:https://www.cnblogs.com/architectforest/p/13051386.html