标签:请求 option include linu font disable virtual manage level
sar(System Activity Reporter系统活动情况报告),可以从多方面对系统的活动进行报告,包括:文件的读写情况、系统调用的使用情况、磁盘I/O、CPU、内存使用状况、进程活动及IPC有关的活动等。
[root@node0 ~]# sar -h
Usage: sar [ options ] [ <interval> [ <count> ] ]
Main options and reports:
????-b????I/O and transfer rate statistics显示I/O和传送速率的统计信息
????-B????Paging statistics 内存分页统计信息
????-d????Block device statistics 显示块设备的统计信息
????-I { <int> | SUM | ALL | XALL }
????????Interrupts statistics
????-m????Power management statistics
????-n { <keyword> [,...] | ALL }
????????Network statistics
????????Keywords are:
????????DEV????Network interfaces
????????EDEV????Network interfaces (errors)
????????NFS????NFS client
????????NFSD????NFS server
????????SOCK????Sockets????(v4)
????????IP????IP traffic????(v4)
????????EIP????IP traffic????(v4) (errors)
????????ICMP????ICMP traffic????(v4)
????????EICMP????ICMP traffic????(v4) (errors)
????????TCP????TCP traffic????(v4)
????????ETCP????TCP traffic????(v4) (errors)
????????UDP????UDP traffic????(v4)
????????SOCK6????Sockets????(v6)
????????IP6????IP traffic????(v6)
????????EIP6????IP traffic????(v6) (errors)
????????ICMP6????ICMP traffic????(v6)
????????EICMP6????ICMP traffic????(v6) (errors)
????????UDP6????UDP traffic????(v6)
????-q????Queue length and load average statistics 队列长度和平均负载
????-r????Memory utilization statistics 显示内存使用的统计信息
????-R????Memory statistics 显示内存页面的统计信息
????-S????Swap space utilization statistics 显示swap空间的统计信息
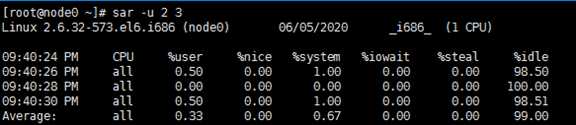
????-u [ ALL ]
????????CPU utilization statistics 显示CPU的统计信息
????-v????Kernel table statistics????????显示inode、文件和其他内核表的统计信息
????-w????Task creation and system switching statistics
????-W????Swapping statistics swap统计信息
????-y????TTY device statistics 显示设备终端统计信息

Report CPU utilization. The ALL keyword indicates that all the CPU fields should be displayed. The report may show the following
fields:
%user 用户进程占用的CPU
Percentage of CPU utilization that occurred while executing at the user level (application). Note that this field includes
time spent running virtual processors.
%usr 用户进程占用的CPU
Percentage of CPU utilization that occurred while executing at the user level (application). Note that this field does NOT
include time spent running virtual processors.
%nice 调整过nice值打的进程占用的CPU
Percentage of CPU utilization that occurred while executing at the user level with nice priority.
%system 系统进程占用的CPU,包括硬中断和软中断
Percentage of CPU utilization that occurred while executing at the system level (kernel). Note that this field includes time
spent servicing hardware and software interrupts.
%sys 系统进程占用的CPU,不包括硬中断和软中断
Percentage of CPU utilization that occurred while executing at the system level (kernel). Note that this field does NOT
include time spent servicing hardware or software interrupts.
%iowait CPU等待IO操作的百分比
Percentage of time that the CPU or CPUs were idle during which the system had an outstanding disk I/O request.
%steal
Percentage of time spent in involuntary wait by the virtual CPU or CPUs while the hypervisor was servicing another virtual
processor.
%irq
Percentage of time spent by the CPU or CPUs to service hardware interrupts.
%soft 软中断占用的CPU
Percentage of time spent by the CPU or CPUs to service software interrupts.
%guest
Percentage of time spent by the CPU or CPUs to run a virtual processor.
%idle CPU空闲时间百分比
Percentage of time that the CPU or CPUs were idle and the system did not have an outstanding disk I/O request.
Note: On SMP machines a processor that does not have any activity at all (0.00 for every field) is a disabled (offline) processor.
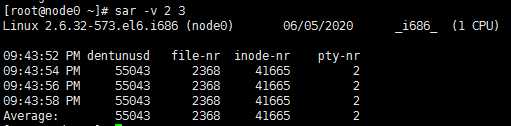
dentunusd 目录缓存中未使用的条目数量
Number of unused cache entries in the directory cache.
file-nr 文件句柄数量
Number of file handles used by the system.
inode-nr inode数量
Number of inode handlers used by the system.
pty-nr pty使用数量
Number of pseudo-terminals used by the system.
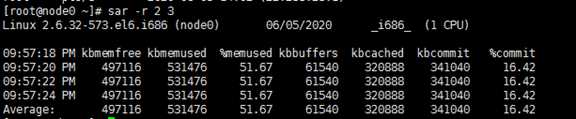
Report memory utilization statistics. The following values are displayed:
kbmemfree 剩余内存,不包括buffer和cahce
Amount of free memory available in kilobytes.
kbmemused 已用内存,不包括buffer和cahce
Amount of used memory in kilobytes. This does not take into account memory used by the kernel itself.
%memused 已用内存比上总内存
Percentage of used memory.
kbbuffers buffer大小
Amount of memory used as buffers by the kernel in kilobytes.
kbcached cache大小
Amount of memory used to cache data by the kernel in kilobytes.
kbcommit 保证当前系统工作需要的内存大小
Amount of memory in kilobytes needed for current workload. This is an estimate of how much RAM/swap is needed to guarantee
that there never is out of memory.
%commit 当前负载和内存总量的百分比
Percentage of memory needed for current workload in relation to the total amount of memory (RAM+swap). This number may be
greater than 100% because the kernel usually overcommits memory.
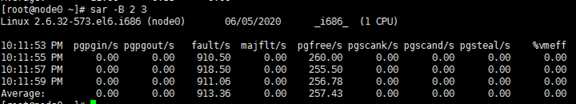
Report paging statistics. Some of the metrics below are available only with post 2.5 kernels. The following values are displayed:
pgpgin/s 每秒从磁盘page in到内存的大小
Total number of kilobytes the system paged in from disk per second. Note: With old kernels (2.2.x) this value is a number
of blocks per second (and not kilobytes).
pgpgout/s 每秒从内存page out到磁盘的大小
Total number of kilobytes the system paged out to disk per second. Note: With old kernels (2.2.x) this value is a number of
blocks per second (and not kilobytes).
fault/s 每秒产生的缺页数(major + minor)
Number of page faults (major + minor) made by the system per second. This is not a count of page faults that generate I/O,
because some page faults can be resolved without I/O.
majflt/s 每秒产生的major缺页数
Number of major faults the system has made per second, those which have required loading a memory page from disk.
pgfree/s 每秒被系统放入空闲队列中的页数
Number of pages placed on the free list by the system per second.
pgscank/s 每秒被kswapd扫描的页数
Number of pages scanned by the kswapd daemon per second.
pgscand/s 每秒直接被扫描的页数
Number of pages scanned directly per second.
pgsteal/s 每秒从cache中清除以满足内存需求的页数
Number of pages the system has reclaimed from cache (pagecache and swapcache) per second to satisfy its memory demands.
%vmeff 每秒清除的页(pgsteal)占总扫描页(pgscank+pgscand)的百分比
Calculated as pgsteal / pgscan, this is a metric of the efficiency of page reclaim. If it is near 100% then almost every
page coming off the tail of the inactive list is being reaped. If it gets too low (e.g. less than 30%) then the virtual mem-
ory is having some difficulty. This field is displayed as zero if no pages have been scanned during the interval of time.
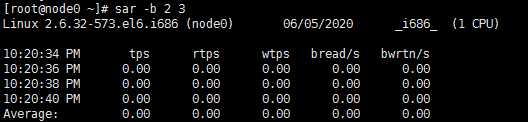
Report I/O and transfer rate statistics. The following values are displayed:
tps 每秒钟的IO个数
Total number of transfers per second that were issued to physical devices. A transfer is an I/O request to a physical
device. Multiple logical requests can be combined into a single I/O request to the device. A transfer is of indeterminate size.
rtps 每秒钟的读IO个数
Total number of read requests per second issued to physical devices.
wtps 每秒钟的写IO个数
Total number of write requests per second issued to physical devices.
bread/s 每秒钟读的块的个数
Total amount of data read from the devices in blocks per second. Blocks are equivalent to sectors with 2.4 kernels and
newer and therefore have a size of 512 bytes. With older kernels, a block is of indeterminate size.
bwrtn/s 每秒钟写的块的个数
Total amount of data written to devices in blocks per second.
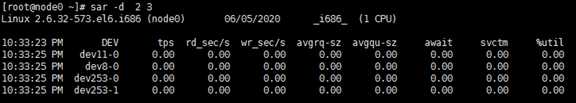
rd_sec/s 每秒读扇区个数
Number of sectors read from the device. The size of a sector is 512 bytes.
wr_sec/s 每秒写扇区个数
Number of sectors written to the device. The size of a sector is 512 bytes.
avgrq-sz 平均IO大小
The average size (in sectors) of the requests that were issued to the device.
avgqu-sz 平均磁盘队列请求长度
The average queue length of the requests that were issued to the device.
await 从IO请求到完成处理(IO队列+IO处理),花费的平均时间(毫秒)
The average time (in milliseconds) for I/O requests issued to the device to be served. This includes the time spent by the
requests in queue and the time spent servicing them.
svctm IO处理的平均时间
The average service time (in milliseconds) for I/O requests that were issued to the device.
%util IO操作占CPU百分比
Percentage of elapsed time during which I/O requests were issued to the device (bandwidth utilization for the device).
Device saturation occurs when this value is close to 100%.
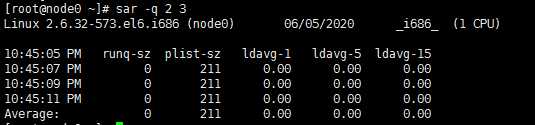
runq-sz 等待运行的进程数
Run queue length (number of tasks waiting for run time).
plist-sz 进程列表中的进程数
Number of tasks in the task list.
ldavg-1 最近1分钟的平均负载
System load average for the last minute. The load average is calculated as the average number of runnable or running tasks
(R state), and the number of tasks in uninterruptible sleep (D state) over the specified interval.
ldavg-5 最近5分钟的平均负载
System load average for the past 5 minutes.
ldavg-15 最近15分钟的平均负载
System load average for the past 15 minutes.
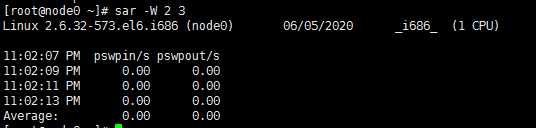
pswpin/s 每秒page in的页面数
Total number of swap pages the system brought in per second.
pswpout/s 每秒page out的页面数
Total number of swap pages the system brought out per second.
?
标签:请求 option include linu font disable virtual manage level
原文地址:https://www.cnblogs.com/jeancheng/p/13052843.html