标签:lazy pyplot render 图片 bresenham otl end first ror
原文:https://github.com/ssloy/tinyrenderer/wiki/Lesson-1-Bresenham’s-Line-Drawing-Algorithm
关于该绘制直线算法的另外介绍:https://www.cnblogs.com/wlzy/p/8695226.html
给定一条线的两个点,先用最简单的插值方式进行实现,具体如下:
import matplotlib.pyplot as plt
from PIL import Image
import numpy as np
def draw_line(image, p0, p1,color=(255,0,0), step=0.1):
    x = np.arange(p0[0], p1[0]+step, step)
    y = np.arange(p0[1], p1[1]+step, step)
    for (x,y) in zip(x,y):
        image.putpixel((int(x), int(y)), color)
image1 = Image.new("RGB",(100, 100),(0,0,0))
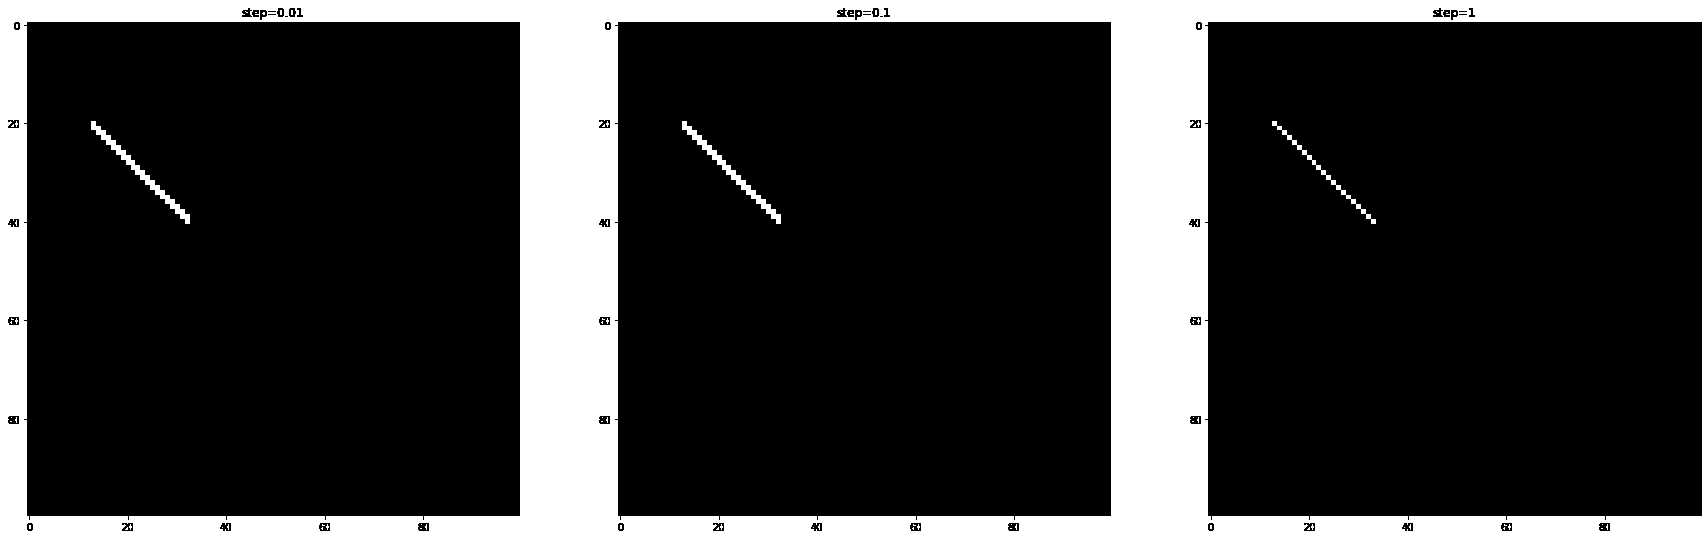
draw_line(image1, (13,20), (80, 40), color=(255,255,255), step=0.01)
fig = plt.figure(figsize=(30,300))
ax = fig.add_subplot(131)
ax.imshow(image1)
ax.set_title("step=0.01")
image2 = Image.new("RGB",(100, 100),(0,0,0))
draw_line(image2, (13,20), (80, 40), color=(255,255,255), step=0.1)
ax = fig.add_subplot(132)
ax.imshow(image2)
ax.set_title("step=0.1")
image3 = Image.new("RGB",(100, 100),(0,0,0))
draw_line(image3, (13,20), (80, 40), color=(255,255,255), step=1.0)
ax = fig.add_subplot(133)
ax.imshow(image3)
ax.set_title("step=1")
print("image with step0.01 is equal to step0.1? ", image1 == image2)
print("image with step0.01 is equal to step1? ", image1 == image3)
image with step0.01 is equal to step0.1?  True
image with step0.01 is equal to step1?  False
第一次尝试得到的结果是,step为0.1和0.01的时候得到相同的结果,但是在0.01的时候需要更多的遍历,会降低性能。为了降低性能,我们进行如下尝试,利用起止点的x值来计算采样步长,对y值进行采样:
def draw_line2(p0, p1, color, fig, pos):
    image = Image.new("RGB",(100, 100),(0,0,0))
    # 计算x值
    step = 1 if p1[0] > p0[0] else -1
    x = np.arange(p0[0], p1[0]+step, step)
    # 计算采样步长
    t = (x - p0[0])/(p1[0] - p0[0])
    # 对y进行采样
    y = p0[1]*(1 - t) + p1[1] * t;
    for (a, b) in zip(x, y):
        image.putpixel((int(a),int(b)), color)
    ax = fig.add_subplot(pos)
    ax.imshow(image)
fig = plt.figure(figsize=(30,300))

draw_line2((13, 20), (80, 40), (255, 255, 255), fig, 131)
draw_line2((20, 13), (40, 80), (255, 0, 0), fig, 132)
draw_line2((80, 40), (13, 20), (255, 0, 0), fig, 133)
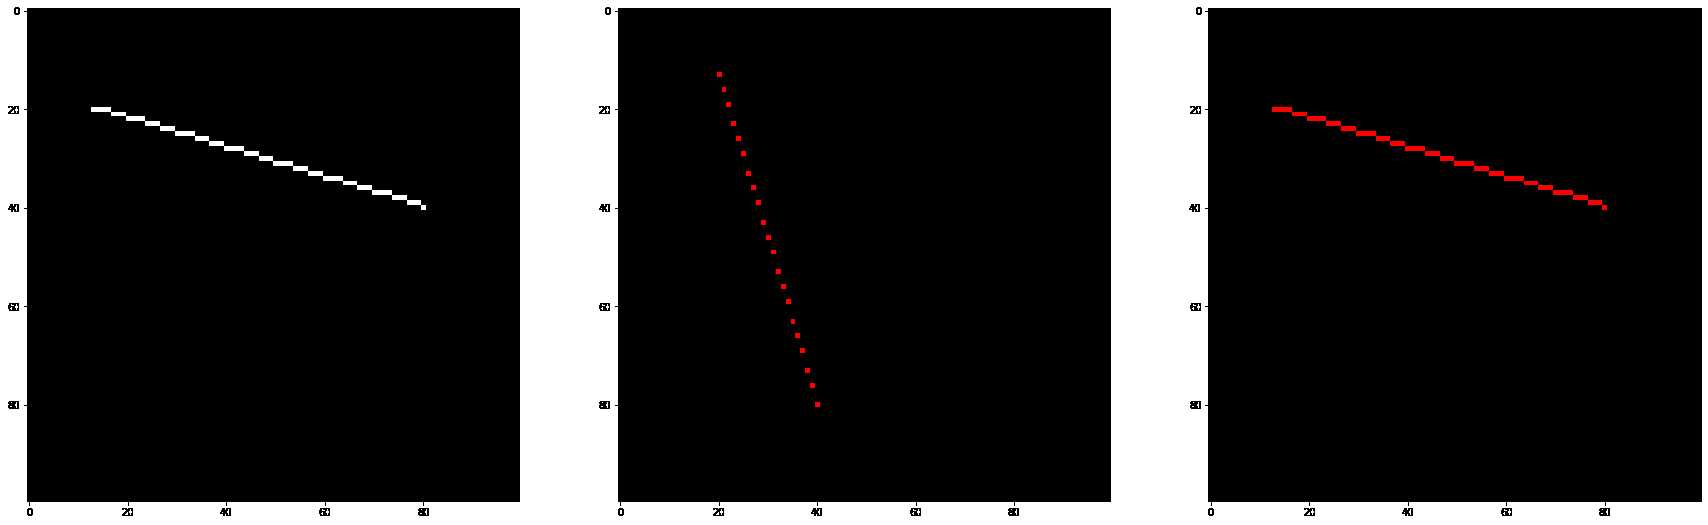
从上面的结果可以发现,当x方向的距离小于y方向的距离的时候会导致采样不足。第二个图点和点之间出现了空洞。下面进行第三次尝试。
def draw_line3(p0, p1, color, fig, pos):
    image = Image.new("RGB",(100, 100),(0,0,0))

    distance = abs(np.array(p0)-np.array(p1))
    # 确定距离大的一方,来确定采样步长
    maxIndex = 0 if distance[0] > distance[1] else 1
    # 计算采样步长
    step = 1 if p1[maxIndex] > p0[maxIndex] else -1
    pt_1 = np.arange(p0[maxIndex], p1[maxIndex] + step, step)
    t = (pt_1 - p0[maxIndex]) / (p1[maxIndex] - p0[maxIndex])
    # 对另一方,按照步长进行采样
    pt_2 = p0[1-maxIndex] * (1 - t) + p1[1-maxIndex]* t

    for (a, b) in zip(pt_1, pt_2):
        if maxIndex == 0:  # 说明xy顺序没有发生变化
            image.putpixel((int(a),int(b)), color)
        else:              # 说明xy顺序进行了调整
            image.putpixel((int(b), int(a)), color)
    ax = fig.add_subplot(pos)
    ax.imshow(image)
fig = plt.figure(figsize=(30,300))
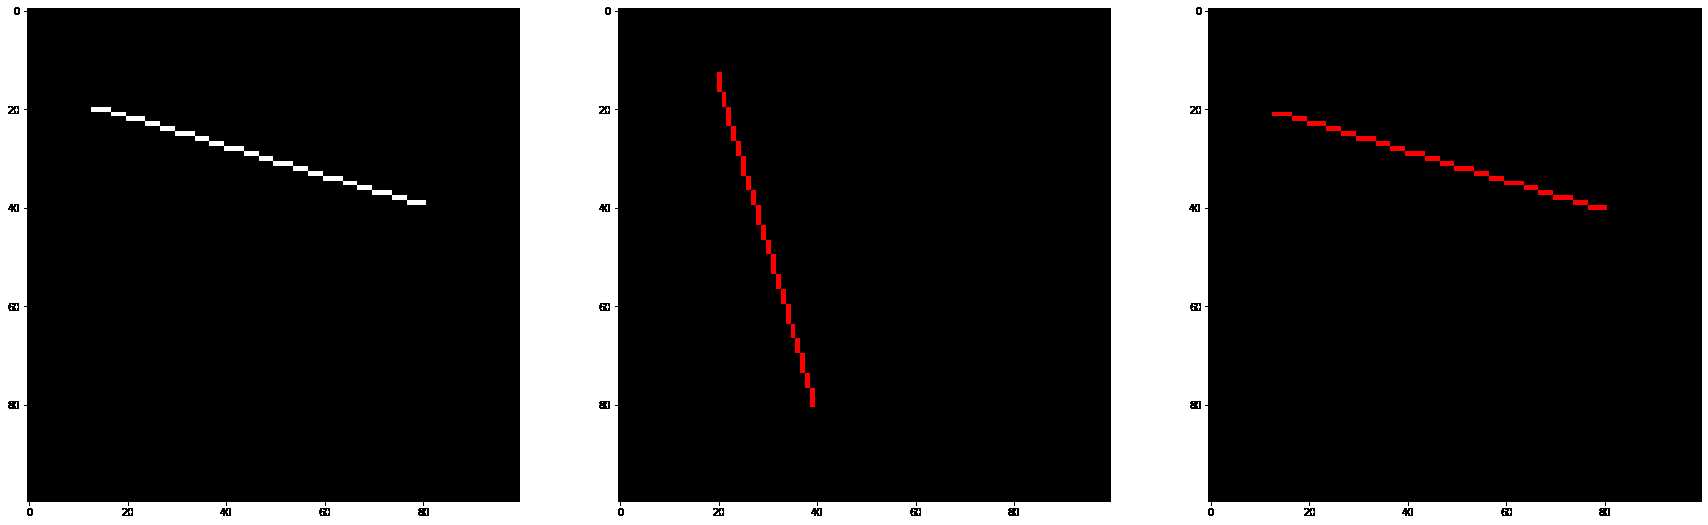
draw_line3((13, 20), (80, 40), (255, 255, 255), fig, 131)
draw_line3((20, 13), (40, 80), (255, 0, 0), fig, 132)
draw_line3((80, 40), (13, 20), (255, 0, 0), fig, 133)

python关于性能分析和时间统计可以参考:https://blog.csdn.net/lhh08hasee/article/details/80032193 此处不进行额外的介绍。详细可以参见原文。从理论上理解,以较长距离的维度来确定采样步长,那么在较短的维度上进行采样的时候,会采样得到比实际像素点多很多的点。举个例子:P1(20,20), P2(80,30),
那么采样点的数量会有80-20=60个点,而较短的维度上的像素距离仅有10个点,那么久没必要采样60个点。因此可以程序进行优化:
def draw_line4(p0, p1, color, fig, pos):
    image = Image.new("RGB",(100, 100),(0,0,0))

    distance = abs(np.array(p0)-np.array(p1))
    # 确定距离大的一方,来确定采样步长
    maxIndex = 0 if distance[0] > distance[1] else 1
    minIndex = 1 - maxIndex

    # 计算采样步长
    step1 = 1 if p1[maxIndex] > p0[maxIndex] else -1
    step2 = 1 if p1[minIndex] > p0[minIndex] else -1

    # 计算另一方,一个采样步长对应的递增步长
    dy = abs((p1[minIndex] - p0[minIndex])/(p1[maxIndex] - p0[maxIndex]))

    b = p0[minIndex]
    error = 0
    for a in range(p0[maxIndex], p1[maxIndex] + step1, step1):
        if maxIndex == 0: # 说明xy顺序没有发生变化
            image.putpixel((int(a),int(b)), color)
        else:
            image.putpixel((int(b), int(a)), color)
        error = error + dy
        if error > 0.5:
            b = b + step2
            error = error - 1.
    ax = fig.add_subplot(pos)
    ax.imshow(image)
fig = plt.figure(figsize=(30,300))

draw_line4((13, 20), (80, 40), (255, 255, 255), fig, 131)
draw_line4((20, 13), (40, 80), (255, 0, 0), fig, 132)
draw_line4((80, 40), (13, 20), (255, 0, 0), fig, 133)

第5次尝试中,将浮点型替换成了整型,这里就不进行第5次尝试了。
绘制平面三角形线。
def generate_triangle2d(num, max_value):
    return np.random.choice(range(0, max_value), size=(num, 3, 2))


def draw_line5(p0, p1, image, color):
    distance = abs(np.array(p0)-np.array(p1))
    # 确定距离大的一方,来确定采样步长
    maxIndex = 0 if distance[0] > distance[1] else 1
    minIndex = 1 - maxIndex

    # 计算采样步长
    step1 = 1 if p1[maxIndex] > p0[maxIndex] else -1
    step2 = 1 if p1[minIndex] > p0[minIndex] else -1

    # 计算另一方,一个采样步长对应的递增步长
    dy = abs((p1[minIndex] - p0[minIndex])/(p1[maxIndex] - p0[maxIndex]))

    b = p0[minIndex]
    error = 0
    for a in range(p0[maxIndex], p1[maxIndex] + step1, step1):
        if maxIndex == 0: # 说明xy顺序没有发生变化
            image.putpixel((int(a),int(b)), color)
        else:
            image.putpixel((int(b), int(a)), color)
        error = error + dy
        if error > 0.5:
            b = b + step2
            error = error - 1.
triangle_num = 5
image = Image.new("RGB", (300, 300), (0,0,0))
triangles3d = generate_triangle2d(triangle_num, 300)

color = [(255, 0, 0), (0, 255, 0), (0, 0, 255), (255,255,0), (0,255,255)]
for i in range(triangle_num):
    draw_line5(triangles3d[i][0], triangles3d[i][1], image, color[i])
    draw_line5(triangles3d[i][1], triangles3d[i][2], image, color[i])
    draw_line5(triangles3d[i][2], triangles3d[i][0], image, color[i])

fig = plt.figure(figsize=(8,8))
ax = fig.add_subplot(111)
ax.imshow(image)
Tinyrender-Lesson 1 Bresenham’s Line Drawing Algorithm
标签:lazy pyplot render 图片 bresenham otl end first ror
原文地址:https://www.cnblogs.com/grass-and-moon/p/13184254.html