标签:serial sources 配置 访问 get main 生成 图片 prope
第一步:下载
wget https://artifacts.elastic.co/downloads/logstash/logstash-7.6.1.tar.gz
第二步:解压即安装
tar -zxvf logstash-7.6.1.tar.gz
第三步:启动,并测试标准输入和标准输出
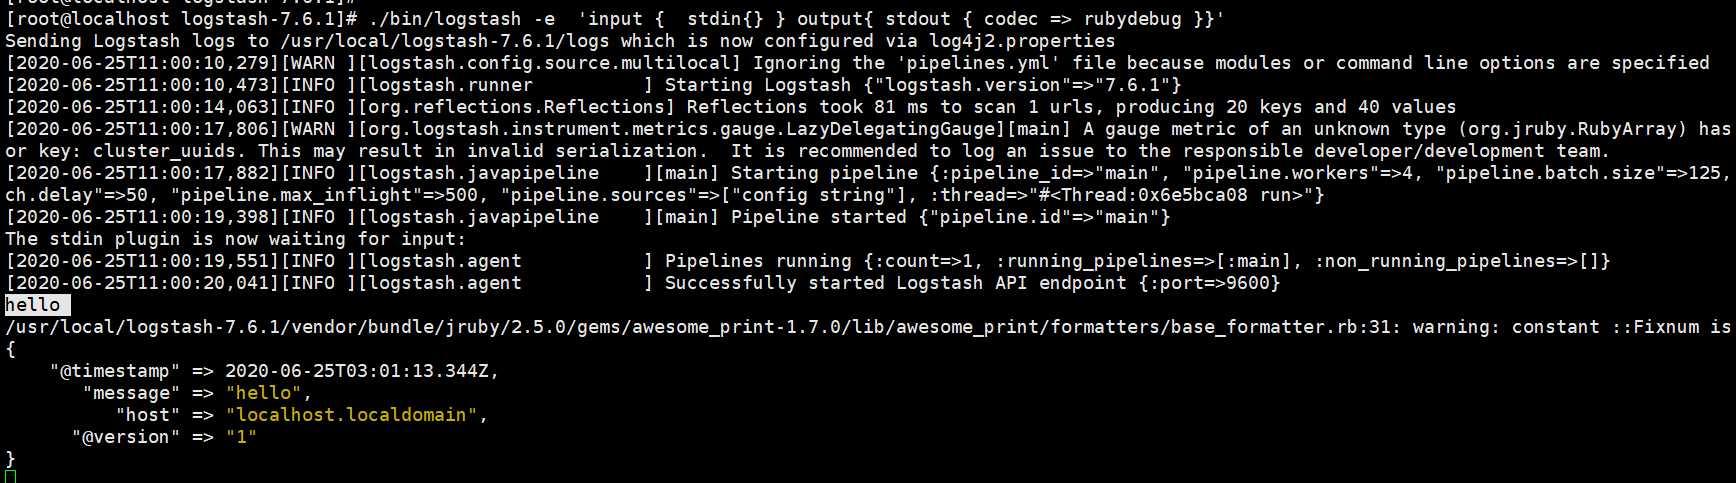
进入解压后的logstash的bin目录,执行启动命令:./bin/logstash -e ‘input { stdin{} } output{ stdout { codec => rubydebug }}‘
启动成功后,随便输入,比如hello,看输出结果
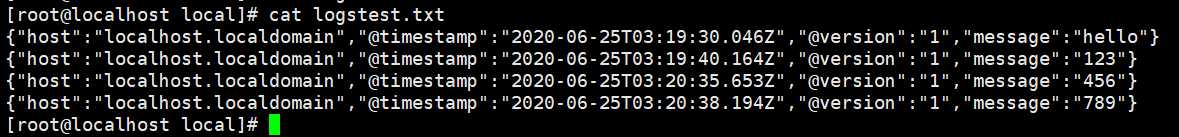
测试输出数据到指定文件中:
[root@localhost logstash-7.6.1]# ./bin/logstash -e  ‘input {  stdin{} } output{ file { path => "/usr/local/logstest.txt"}}‘
Sending Logstash logs to /usr/local/logstash-7.6.1/logs which is now configured via log4j2.properties
[2020-06-25T11:17:28,699][WARN ][logstash.config.source.multilocal] Ignoring the ‘pipelines.yml‘ file because modules or command line options are specified
[2020-06-25T11:17:29,008][INFO ][logstash.runner          ] Starting Logstash {"logstash.version"=>"7.6.1"}
[2020-06-25T11:17:33,063][INFO ][org.reflections.Reflections] Reflections took 77 ms to scan 1 urls, producing 20 keys and 40 values
[2020-06-25T11:17:34,400][WARN ][org.logstash.instrument.metrics.gauge.LazyDelegatingGauge][main] A gauge metric of an unknown type (org.jruby.RubyArray) has been create for key: cluster_uuids. This may result in invalid serialization.  It is recommended to log an issue to the responsible developer/development team.
[2020-06-25T11:17:34,467][INFO ][logstash.javapipeline    ][main] Starting pipeline {:pipeline_id=>"main", "pipeline.workers"=>4, "pipeline.batch.size"=>125, "pipeline.batch.delay"=>50, "pipeline.max_inflight"=>500, "pipeline.sources"=>["config string"], :thread=>"#<Thread:0x7c7626b9 run>"}
[2020-06-25T11:17:36,246][INFO ][logstash.javapipeline    ][main] Pipeline started {"pipeline.id"=>"main"}
The stdin plugin is now waiting for input:
[2020-06-25T11:17:36,453][INFO ][logstash.agent           ] Pipelines running {:count=>1, :running_pipelines=>[:main], :non_running_pipelines=>[]}
[2020-06-25T11:17:36,918][INFO ][logstash.agent           ] Successfully started Logstash API endpoint {:port=>9600}
hello
[2020-06-25T11:19:30,306][INFO ][logstash.outputs.file    ][main] Opening file {:path=>"/usr/local/logstest.txt"}
123
[2020-06-25T11:19:54,382][INFO ][logstash.outputs.file    ][main] Closing file /usr/local/logstest.txt
456
[2020-06-25T11:20:35,762][INFO ][logstash.outputs.file    ][main] Opening file {:path=>"/usr/local/logstest.txt"}
789
[2020-06-25T11:20:54,494][INFO ][logstash.outputs.file    ][main] Closing file /usr/local/logstest.txt
至此,logstash安装完成并测试通过
准备工作:
安装es,kibana参见之前文章
安装nginx,参见之前文章linux/centOS 下安装 ngnix
将nginx的日志格式改为Json格式:
   log_format access_json ‘{"@timestamp":"$time_iso8601",‘  # 在http段改为json格式
        ‘"host":"$server_addr",‘
        ‘"clientip":"$remote_addr",‘
        ‘"size":$body_bytes_sent,‘
        ‘"responsetime":$request_time,‘
        ‘"upstreamtime":"$upstream_response_time",‘
        ‘"upstreamhost":"$upstream_addr",‘
        ‘"http_host":"$host",‘
        ‘"url":"$uri",‘
        ‘"domain":"$host",‘
        ‘"xff":"$http_x_forwarded_for",‘
        ‘"referer":"$http_referer",‘
        ‘"status":"$status"}‘;
  access_log  logs/access.log  access_json;  #末尾和起始的名称一致
nginx其他核心配置
 #gzip  on;
    upstream wcf{
     server 192.168.220.129:8080;
    }

    upstream my_site{
     server 192.168.220.129:8081 weight=1;
     server 192.168.220.133:8082 weight=2;
    }

    server {
        listen       80;
        server_name  localhost;
        server_name  my.test.com;

        #charset koi8-r;

        location ~* ^/ws/{
            proxy_pass  http://wcf;
            proxy_redirect off;
            proxy_set_header Host $host;
            proxy_set_header X-Real-IP $remote_addr;
            proxy_set_header X-Forwarded-For $proxy_add_x_forwarded_for;
        }

         location =/{
            proxy_redirect off;
            proxy_set_header Host $host;
            proxy_set_header X-Real-IP $remote_addr;
            proxy_set_header X-Forwarded-For $proxy_add_x_forwarded_for;
            proxy_pass  http://my_site/index;
        }
location ~/{
proxy_redirect off;
proxy_set_header Host $host;
proxy_set_header X-Real-IP $remote_addr;
proxy_set_header X-Forwarded-For $proxy_add_x_forwarded_for;
proxy_pass http://my_site;
}
} 启动nginx
进入logstash的配置文件目录config(其实创建的配置文件可以指定其他目录,启动时指定路径就行)
[root@localhost config]# pwd
/usr/local/logstash-7.6.1/config
[root@localhost config]# vim nginx_elk.conf
input {
  file {
   path => "/usr/local/nginx/logs/access.log"  # 从nginx的日志目录下提取日志文件
   start_position => "beginning"
   stat_interval => 3
   type => "nginx-access-log" #就是个标识,随便写
   codec => "json"   # 标准输入是指定为json格式
  }

}

output {
  if [type] == "nginx-access-log" {
    elasticsearch {
    # hosts => ["192.168.220.101:9201","192.168.220.101:9202","192.168.220.101:9203"]
    hosts => ["192.168.220.101:9200"]  # 输出至elasticsearch服务器上
    index => "nginx-access-log-%{+YYYY.MM.dd}" #要创建的索引名称
  }}
}
通过指定配置文件的方式启动logstash
[root@localhost logstash-7.6.1]# ./bin/logstash -f config/nginx_elk.conf
Sending Logstash logs to /usr/local/logstash-7.6.1/logs which is now configured via log4j2.properties
[2020-06-25T12:14:07,205][WARN ][logstash.config.source.multilocal] Ignoring the ‘pipelines.yml‘ file because modules or command line options are specified
[2020-06-25T12:14:07,500][INFO ][logstash.runner          ] Starting Logstash {"logstash.version"=>"7.6.1"}
[2020-06-25T12:14:12,506][INFO ][org.reflections.Reflections] Reflections took 68 ms to scan 1 urls, producing 20 keys and 40 values
[2020-06-25T12:14:15,192][INFO ][logstash.outputs.elasticsearch][main] Elasticsearch pool URLs updated {:changes=>{:removed=>[], :added=>[http://192.168.220.101:9200/]}}
[2020-06-25T12:14:15,777][WARN ][logstash.outputs.elasticsearch][main] Restored connection to ES instance {:url=>"http://192.168.220.101:9200/"}
[2020-06-25T12:14:15,931][INFO ][logstash.outputs.elasticsearch][main] ES Output version determined {:es_version=>7}
[2020-06-25T12:14:15,945][WARN ][logstash.outputs.elasticsearch][main] Detected a 6.x and above cluster: the `type` event field won‘t be used to determine the document _type {:es_version=>7}
[2020-06-25T12:14:16,180][INFO ][logstash.outputs.elasticsearch][main] New Elasticsearch output {:class=>"LogStash::Outputs::ElasticSearch", :hosts=>["//192.168.220.101:9200"]}
[2020-06-25T12:14:16,440][INFO ][logstash.outputs.elasticsearch][main] Using default mapping template
[2020-06-25T12:14:16,681][WARN ][org.logstash.instrument.metrics.gauge.LazyDelegatingGauge][main] A gauge metric of an unknown type (org.jruby.specialized.RubyArrayOneObject) has been create for key: cluster_uuids. This may result in invalid serialization.  It is recommended to log an issue to the responsible developer/development team.
[2020-06-25T12:14:16,690][INFO ][logstash.javapipeline    ][main] Starting pipeline {:pipeline_id=>"main", "pipeline.workers"=>4, "pipeline.batch.size"=>125, "pipeline.batch.delay"=>50, "pipeline.max_inflight"=>500, "pipeline.sources"=>["/usr/local/logstash-7.6.1/config/nginx_elk.conf"], :thread=>"#<Thread:0x671e2761 run>"}
[2020-06-25T12:14:16,781][INFO ][logstash.outputs.elasticsearch][main] Attempting to install template {:manage_template=>{"index_patterns"=>"logstash-*", "version"=>60001, "settings"=>{"index.refresh_interval"=>"5s", "number_of_shards"=>1}, "mappings"=>{"dynamic_templates"=>[{"message_field"=>{"path_match"=>"message", "match_mapping_type"=>"string", "mapping"=>{"type"=>"text", "norms"=>false}}}, {"string_fields"=>{"match"=>"*", "match_mapping_type"=>"string", "mapping"=>{"type"=>"text", "norms"=>false, "fields"=>{"keyword"=>{"type"=>"keyword", "ignore_above"=>256}}}}}], "properties"=>{"@timestamp"=>{"type"=>"date"}, "@version"=>{"type"=>"keyword"}, "geoip"=>{"dynamic"=>true, "properties"=>{"ip"=>{"type"=>"ip"}, "location"=>{"type"=>"geo_point"}, "latitude"=>{"type"=>"half_float"}, "longitude"=>{"type"=>"half_float"}}}}}}}
[2020-06-25T12:14:19,028][INFO ][logstash.inputs.file     ][main] No sincedb_path set, generating one based on the "path" setting {:sincedb_path=>"/usr/local/logstash-7.6.1/data/plugins/inputs/file/.sincedb_d2343edad78a7252d2ea9cba15bbff6d", :path=>["/usr/local/nginx/logs/access.log"]}
[2020-06-25T12:14:19,120][INFO ][logstash.javapipeline    ][main] Pipeline started {"pipeline.id"=>"main"}
[2020-06-25T12:14:19,283][INFO ][filewatch.observingtail  ][main] START, creating Discoverer, Watch with file and sincedb collections
[2020-06-25T12:14:19,308][INFO ][logstash.agent           ] Pipelines running {:count=>1, :running_pipelines=>[:main], :non_running_pipelines=>[]}
[2020-06-25T12:14:19,869][INFO ][logstash.agent           ] Successfully started Logstash API endpoint {:port=>9600}
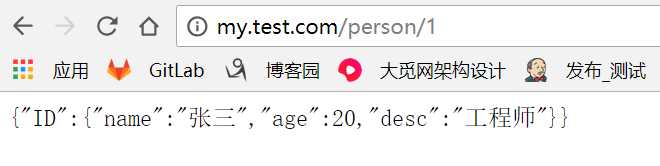
在浏览器测试访问nginx服务器url:http://my.test.com/person/1
查看产生的nginx访问日志access.log
[root@localhost nginx]# vim logs/access.log

{"@timestamp":"2020-06-25T12:36:42+08:00","host":"192.168.220.101","clientip":"192.168.220.1","size":52,"responsetime":0.351,"upstreamtime":"0.351","upstreamhost":"192.168.220.133:8082","http_host":"my.test.com","url":"/person/2","domain":"my.test.com","xff":"-","referer":"-","status":"200"}
{"@timestamp":"2020-06-25T12:37:18+08:00","host":"192.168.220.101","clientip":"192.168.220.1","size":52,"responsetime":0.082,"upstreamtime":"0.082","upstreamhost":"192.168.220.133:8082","http_host":"my.test.com","url":"/person/1","domain":"my.test.com","xff":"-","referer":"-","status":"200"}
{"@timestamp":"2020-06-25T12:37:22+08:00","host":"192.168.220.101","clientip":"192.168.220.1","size":52,"responsetime":0.083,"upstreamtime":"0.083","upstreamhost":"192.168.220.133:8082","http_host":"my.test.com","url":"/person/2","domain":"my.test.com","xff":"-","referer":"-","status":"200"}
{"@timestamp":"2020-06-25T12:37:24+08:00","host":"192.168.220.101","clientip":"192.168.220.1","size":52,"responsetime":0.106,"upstreamtime":"0.106","upstreamhost":"192.168.220.133:8082","http_host":"my.test.com","url":"/person/3","domain":"my.test.com","xff":"-","referer":"-","status":"200"}
{"@timestamp":"2020-06-25T12:37:27+08:00","host":"192.168.220.101","clientip":"192.168.220.1","size":52,"responsetime":0.212,"upstreamtime":"0.212","upstreamhost":"192.168.220.133:8082","http_host":"my.test.com","url":"/person/1","domain":"my.test.com","xff":"-","referer":"-","status":"200"}
{"@timestamp":"2020-06-25T12:37:29+08:00","host":"192.168.220.101","clientip":"192.168.220.1","size":52,"responsetime":0.080,"upstreamtime":"0.080","upstreamhost":"192.168.220.133:8082","http_host":"my.test.com","url":"/person/100","domain":"my.test.com","xff":"-","referer":"-","status":"200"}
{"@timestamp":"2020-06-25T12:37:32+08:00","host":"192.168.220.101","clientip":"192.168.220.1","size":52,"responsetime":0.072,"upstreamtime":"0.072","upstreamhost":"192.168.220.133:8082","http_host":"my.test.com","url":"/person/101","domain":"my.test.com","xff":"-","referer":"-","status":"200"}
{"@timestamp":"2020-06-25T12:37:35+08:00","host":"192.168.220.101","clientip":"192.168.220.1","size":52,"responsetime":0.054,"upstreamtime":"0.054","upstreamhost":"192.168.220.133:8082","http_host":"my.test.com","url":"/person/102","domain":"my.test.com","xff":"-","referer":"-","status":"200"}
{"@timestamp":"2020-06-25T12:37:49+08:00","host":"192.168.220.101","clientip":"192.168.220.1","size":306,"responsetime":0.296,"upstreamtime":"0.296","upstreamhost":"192.168.220.133:8082","http_host":"my.test.com","url":"/persons/200","domain":"my.test.com","xff":"-","referer":"-","status":"404"}
{"@timestamp":"2020-06-25T12:37:56+08:00","host":"192.168.220.101","clientip":"192.168.220.1","size":306,"responsetime":0.217,"upstreamtime":"0.217","upstreamhost":"192.168.220.133:8082","http_host":"my.test.com","url":"/persons/202","domain":"my.test.com","xff":"-","referer":"-","status":"404"}
{"@timestamp":"2020-06-25T12:52:50+08:00","host":"192.168.220.101","clientip":"192.168.220.1","size":306,"responsetime":0.141,"upstreamtime":"0.141","upstreamhost":"192.168.220.133:8082","http_host":"my.test.com","url":"/person1/1","domain":"my.test.com","xff":"-","referer":"-","status":"404"}
{"@timestamp":"2020-06-25T12:52:53+08:00","host":"192.168.220.101","clientip":"192.168.220.1","size":52,"responsetime":0.190,"upstreamtime":"0.190","upstreamhost":"192.168.220.133:8082","http_host":"my.test.com","url":"/person/1","domain":"my.test.com","xff":"-","referer":"-","status":"200"}
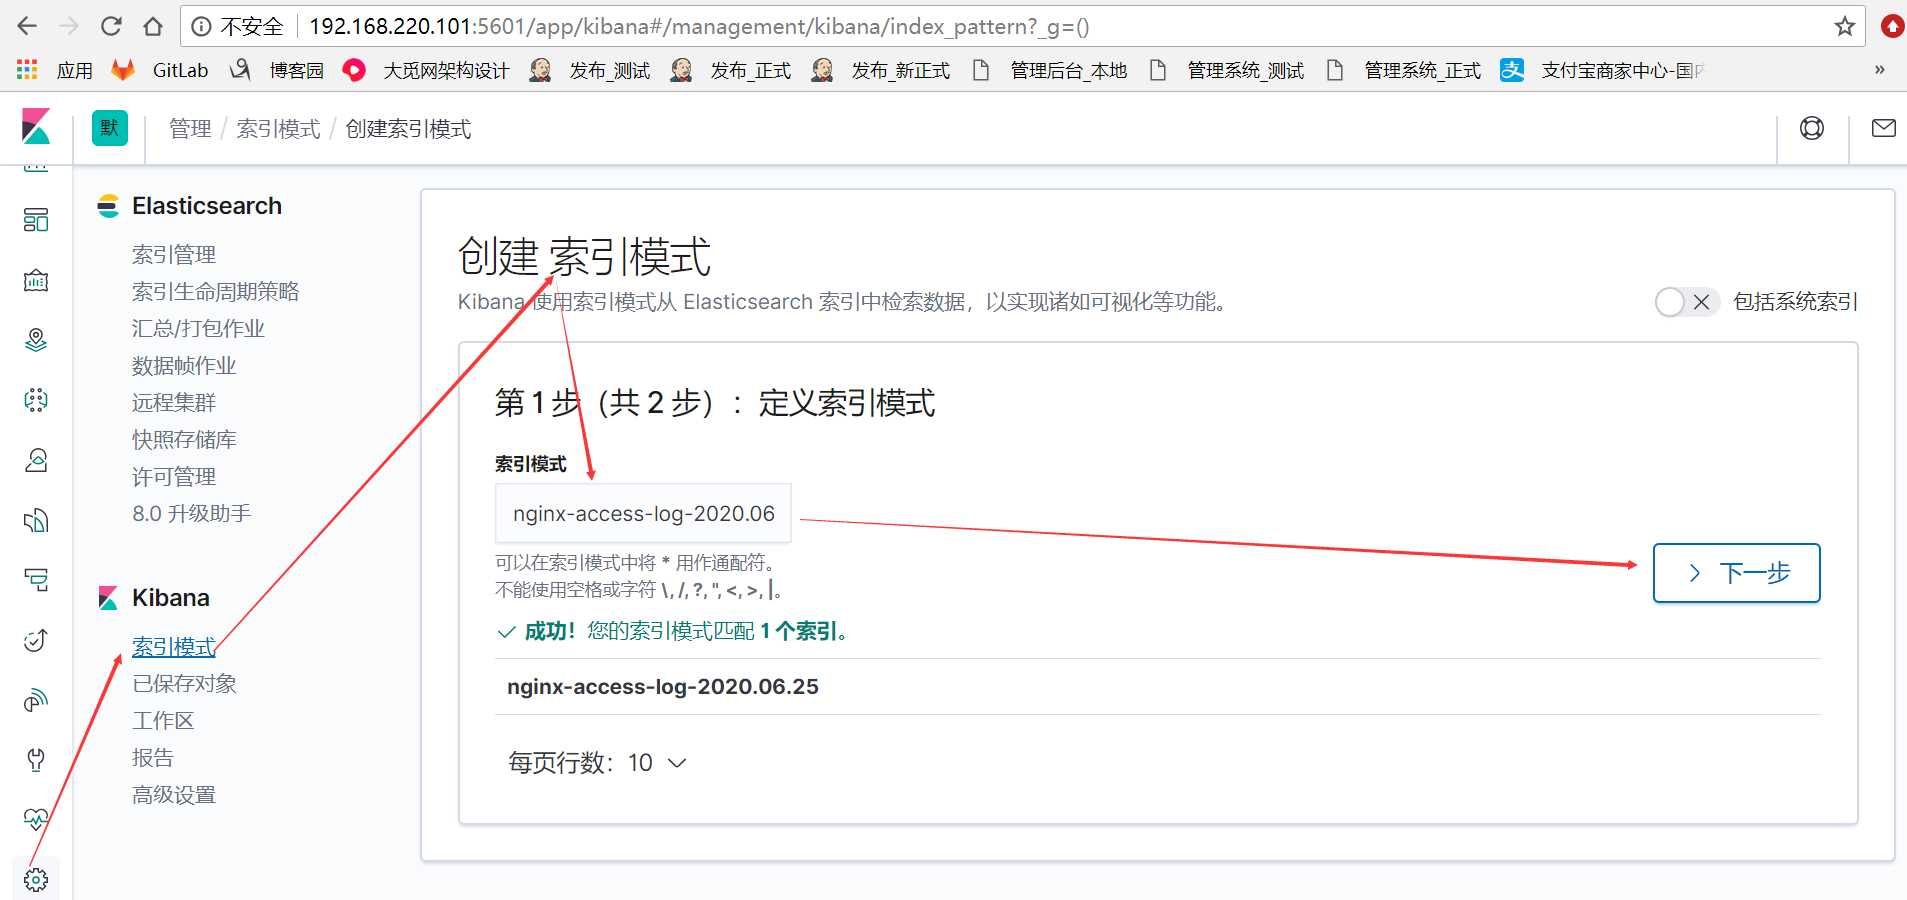
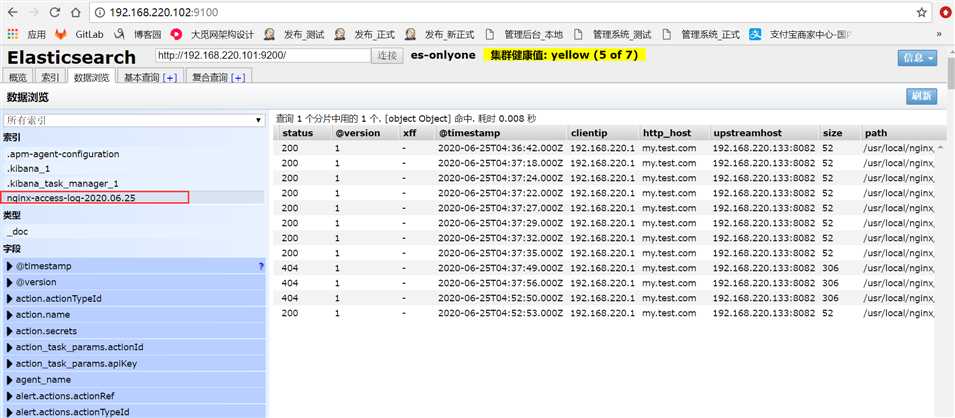
在kibana的discover选项查看刚才创建的nginx日志索引数据信息
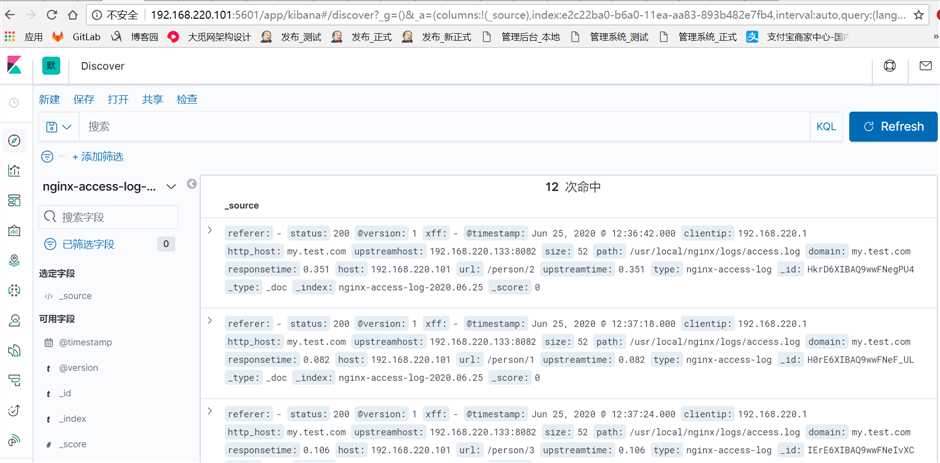
到此,关于nginx日志的ELK搭建完成。
linux安装logstash7.6.1及搭建简单ELK--logstash收集nginx日志
标签:serial sources 配置 访问 get main 生成 图片 prope
原文地址:https://www.cnblogs.com/tyhj-zxp/p/13191379.html