标签:metrics 模板 mes code load global cond 菜单 linux服务
使用Grafana和Prometheus对Linux服务器性能进行监控,主要通过node_exporter进行监控,指标如 CPU、内存、磁盘等。Prometheus通过HTTP协议从远程的机器收集数据并存储Prometheus本地时序数据库。
一.监测服务器安装node_exporter
linux下载: wget https://github.com/prometheus/node_exporter/releases/download/v0.18.1/node_exporter-0.18.1.linux-amd64.tar.gz
解压:tar xzvf node_exporter-0.18.1.linux-amd64.tar.gz
     cd node_exporter-0.18.1.linux-amd64
启动:./node_exporter
二.本地安装prometheus,修改监测配置
1.下载并解压:https://prometheus.io/download/
2.解压后打开,prometheus.yml
# my global config
global:
  scrape_interval:     15s # Set the scrape interval to every 15 seconds. Default is every 1 minute.
  evaluation_interval: 15s # Evaluate rules every 15 seconds. The default is every 1 minute.
  # scrape_timeout is set to the global default (10s).

# Alertmanager configuration
alerting:
  alertmanagers:
  - static_configs:
    - targets:
      # - alertmanager:9093

# Load rules once and periodically evaluate them according to the global ‘evaluation_interval‘.
rule_files:
  # - "first_rules.yml"
  # - "second_rules.yml"

# A scrape configuration containing exactly one endpoint to scrape:
# Here it‘s Prometheus itself.
scrape_configs:
  # The job name is added as a label `job=<job_name>` to any timeseries scraped from this config.
  - job_name: ‘prometheus‘

    # metrics_path defaults to ‘/metrics‘
    # scheme defaults to ‘http‘.

    static_configs:
    - targets: [‘localhost:9090‘]

在末尾加上监测的ip和端口
  - job_name: ‘linux-exporter‘
    metrics_path: /metrics
    static_configs:
    - targets: [‘xxx.xxx.xxx.xxx:9100‘]
3.监测是否监听成功
启动prometheus.exe,本地访问:localhost:9090
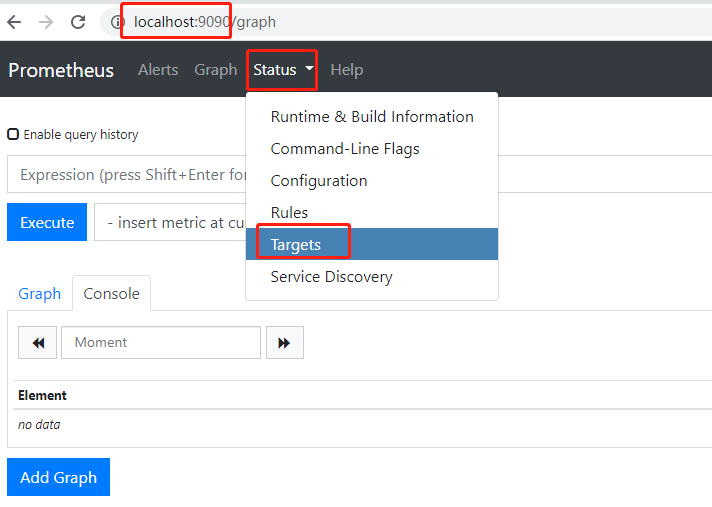
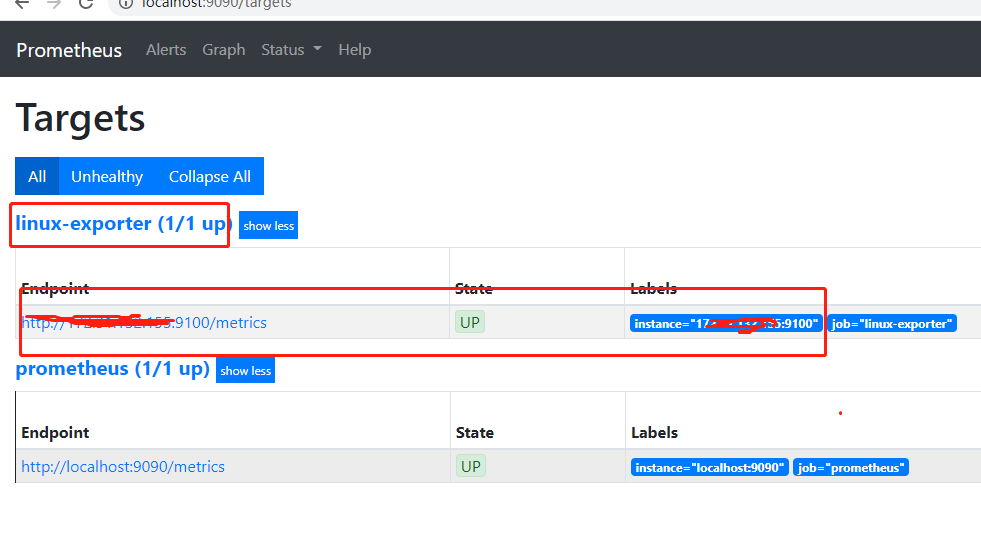
界面展示监听的服务器即表示成功~~~~
三.安装grafana
1.下载:https://grafana.com/grafana/download
2.启动:本地访问localhost:3000
默认admin/admin登录,登录进去会让你修改用户名和密码,修改即可
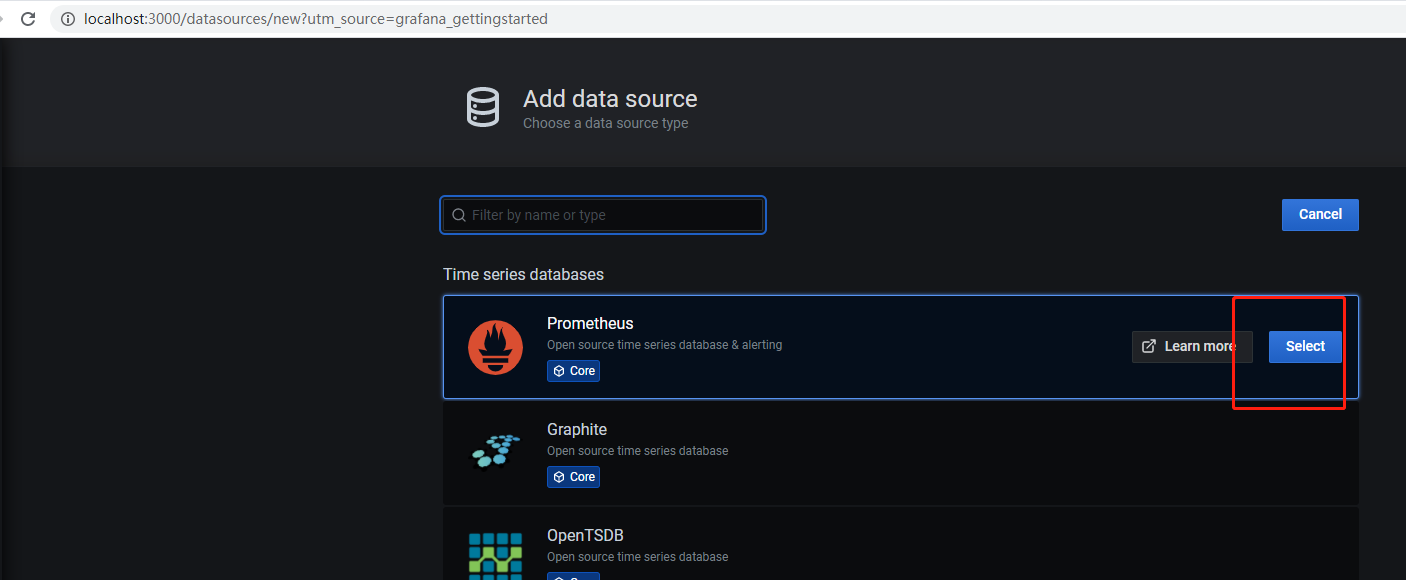
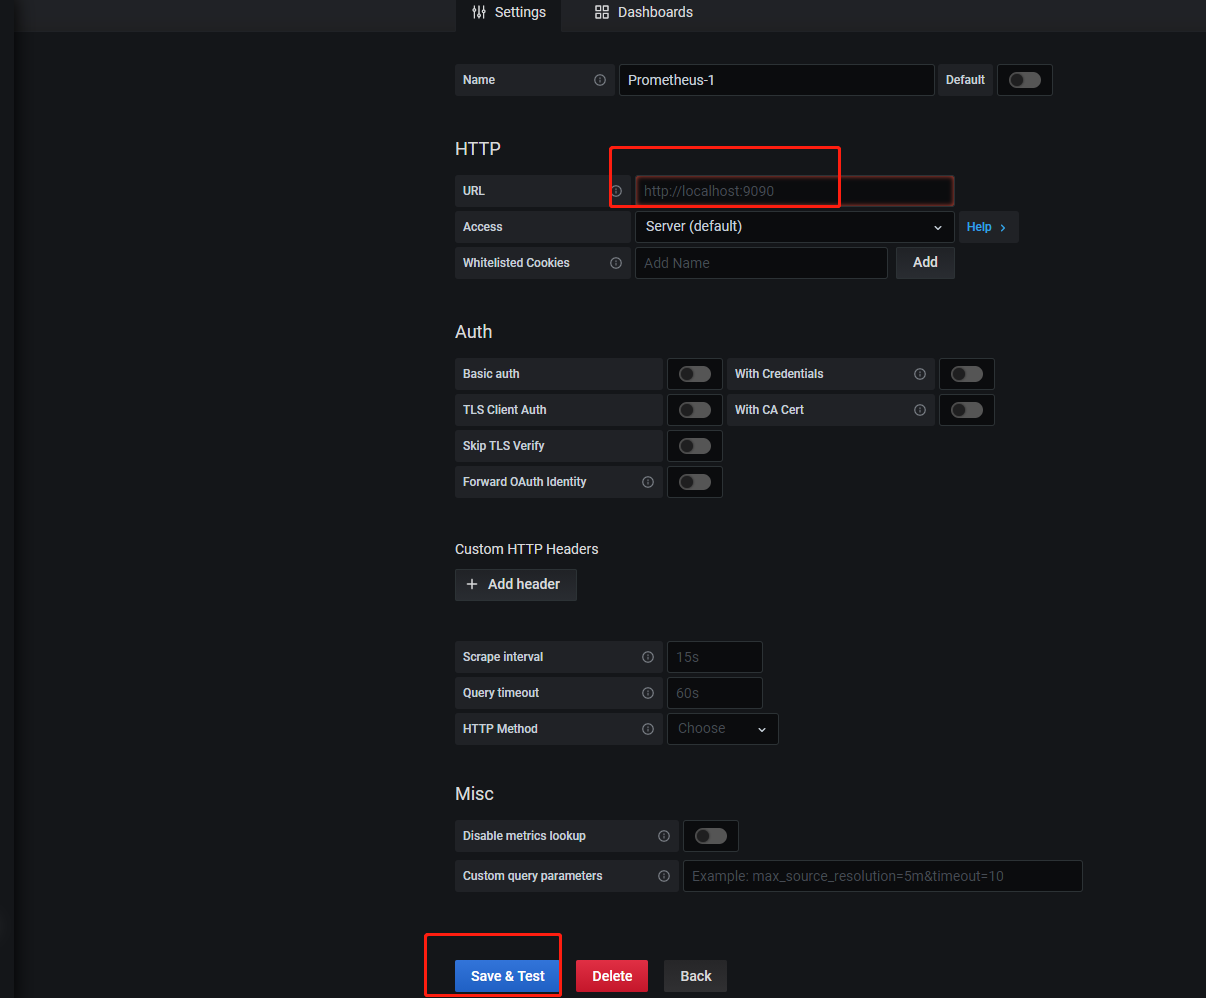
3.选择Prometheus数据源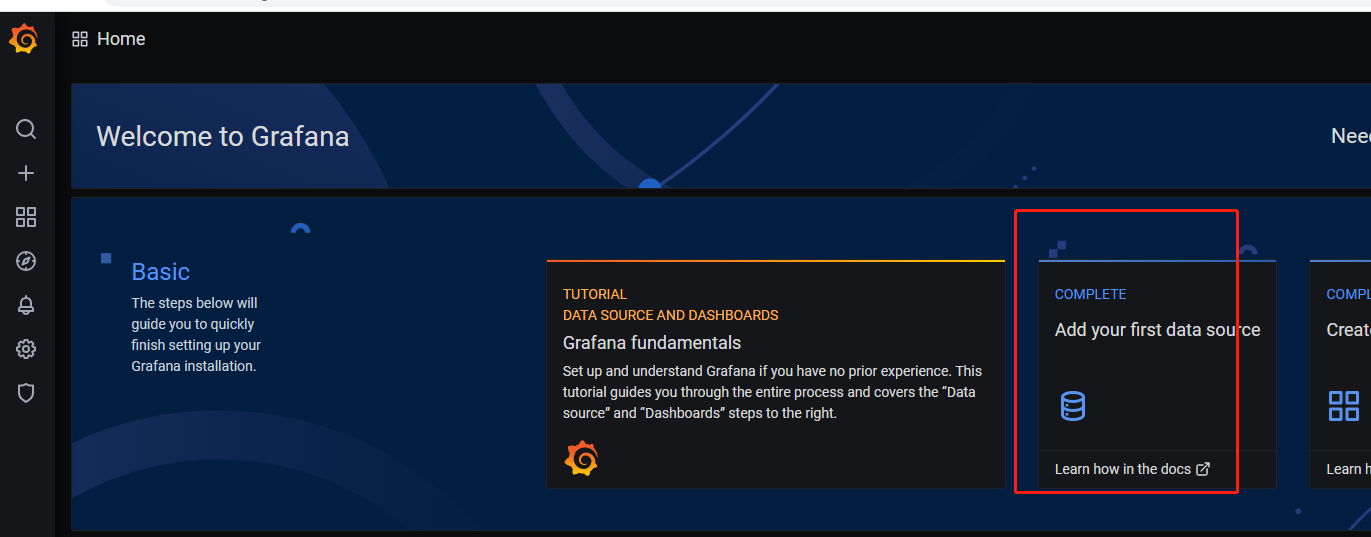
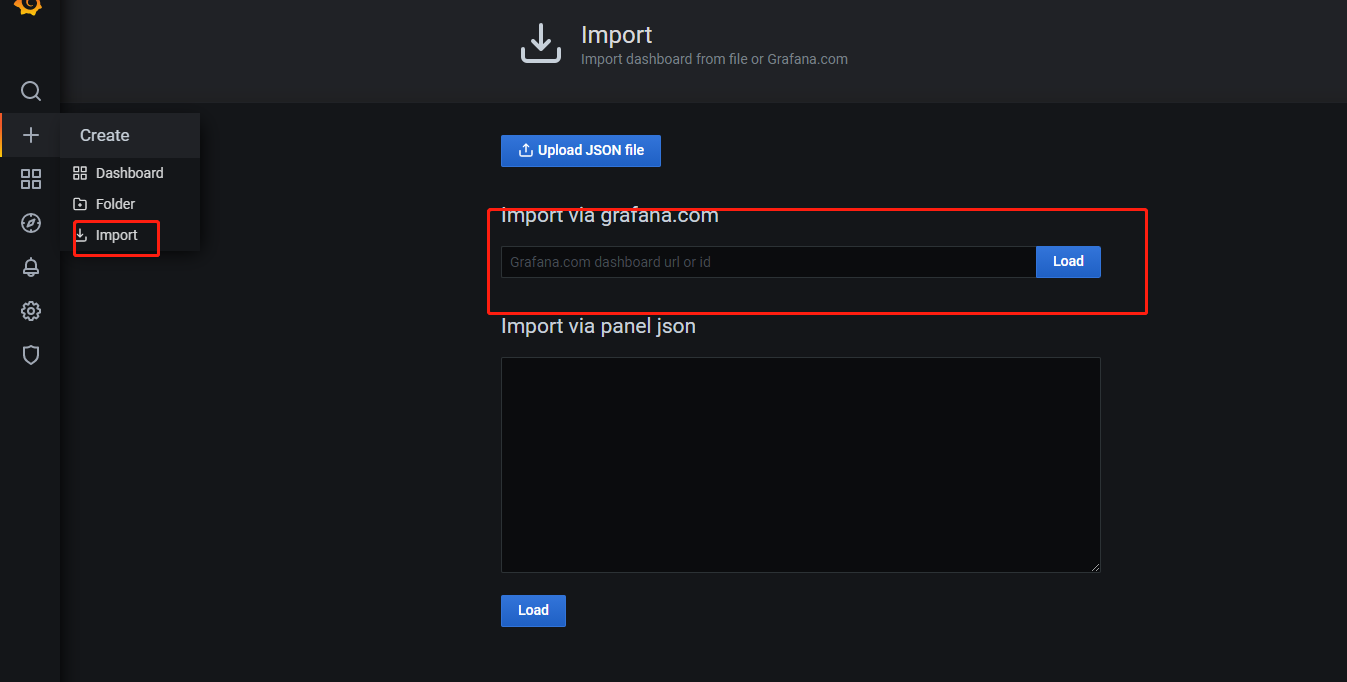
4.进入grafana官网 https://grafana.com/,从菜单栏Grafana中选择Dashboards,进入dashboards模板页面,复制ID,这里用的是8919,在grafana上ipmort 监听模块:

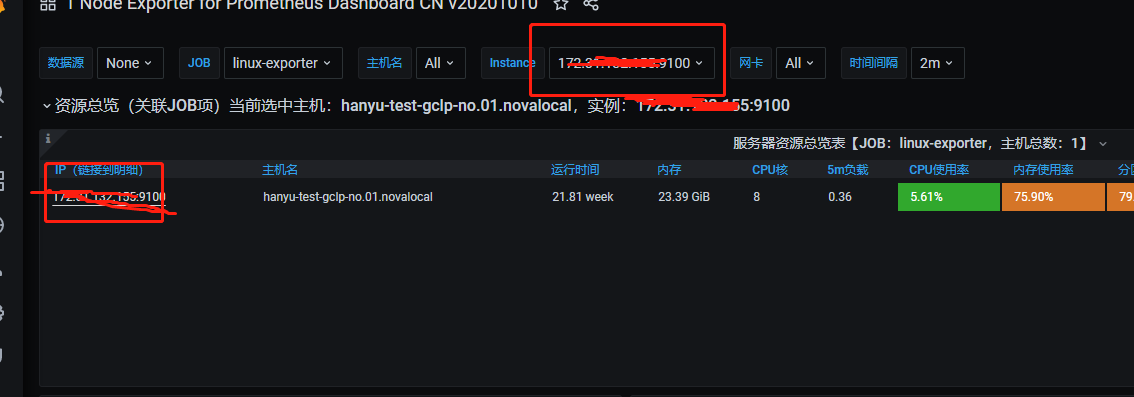
grafana+prometheus+node_exporter+linux
标签:metrics 模板 mes code load global cond 菜单 linux服务
原文地址:https://www.cnblogs.com/jiangger/p/13999615.html