标签:reload elf emd 垃圾 npm zha l数据库 ima imp
基于Promethues与Grafana的Greenplum分布式数据库监控的实现标签(空格分隔): greenplum系列
[toc]
Greenplum是面向数据仓库应用的分布式关系型MPP数据库,基于PostgreSQL开发,跟PostgreSQL的兼容性非常好,大部分PostgreSQL客户端工具及PostgreSQL应用都能运行在Greenplum平台上。GPCC是Greenplum数据库官方商业版的数据库监控软件,对于只能用得起开源的用户来说,只能考虑其他的监控方案了。本文里介绍一种基于Promethues与Grafana的Greenplum分布式数据库监控的实现方案。Prometheus是由SoundCloud开发的开源监控报警系统和时序列数据库(TSDB),使用Go语言开发。Prometheus目前在开源社区相当活跃。Prometheus性能也足够支撑上万台规模的集群。其架构图如下: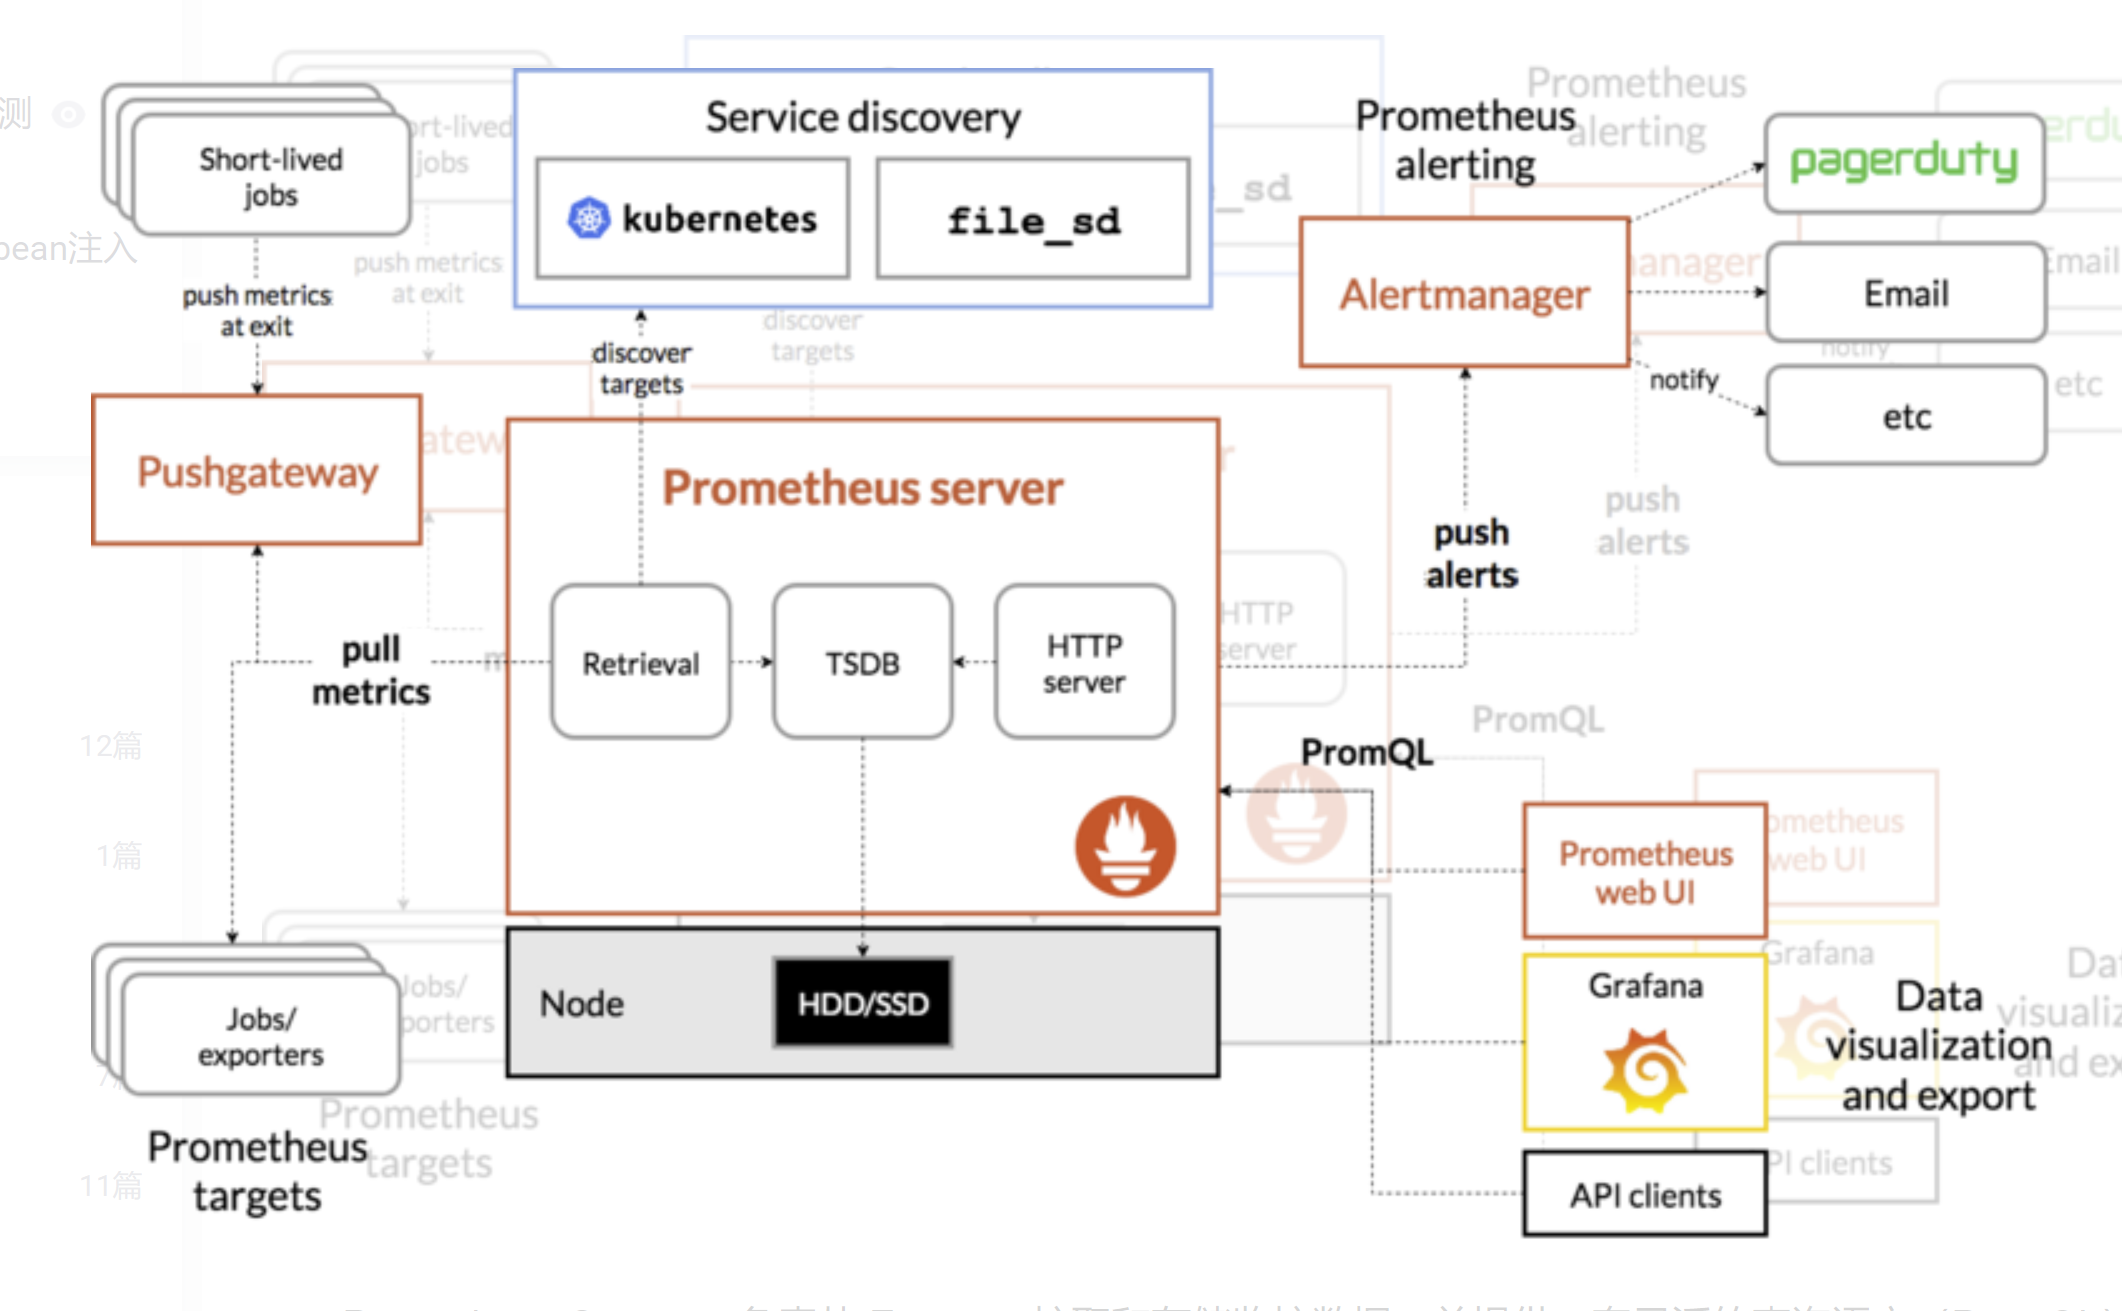
Prometheus Server, 负责从 Exporter 拉取和存储监控数据,并提供一套灵活的查询语言(PromQL)供用户使用。

Exporter, 负责收集目标对象(host, container…)的性能数据,并通过 HTTP 接口供 Prometheus Server 获取。

可视化组件,监控数据的可视化展现对于监控方案至关重要。以前 Prometheus 自己开发了一套工具,不过后来废弃了,因为开源社区出现了更为优秀的产品 Grafana。

Grafana 能够与 Prometheus 无缝集成,提供完美的数据展示能力。

Alertmanager,用户可以定义基于监控数据的告警规则,规则会触发告警。一旦 Alermanager 收到告警,会通过预定义的方式发出告警通知。支持的方式包括 Email、PagerDuty、Webhook 等.Grafana是一个跨平台的开源的度量分析和可视化工具,可以通过将采集的数据查询然后可视化的展示,并及时通知。它主要有以下六大特点:
1、展示方式:快速灵活的客户端图表,面板插件有许多不同方式的可视化指标和日志,官方库中具有丰富的仪表盘插件,比如热图、折线图、图表等多种展示方式;
2、数据源:Graphite,InfluxDB,OpenTSDB,Prometheus,Elasticsearch,CloudWatch和KairosDB等;
3、通知提醒:以可视方式定义最重要指标的警报规则,Grafana将不断计算并发送通知,在数据达到阈值时通过Slack、PagerDuty等获得通知;
4、混合展示:在同一图表中混合使用不同的数据源,可以基于每个查询指定数据源,甚至自定义数据源;
5、注释:使用来自不同数据源的丰富事件注释图表,将鼠标悬停在事件上会显示完整的事件元数据和标记;
6、过滤器:Ad-hoc过滤器允许动态创建新的键/值过滤器,这些过滤器会自动应用于使用该数据源的所有查询。Greenplum的监控可类似于PostgreSQL来实现,但又存在差异,不同点在于:
要实现一个Greenplum的Exporter指标采集器;
使用Grafana绘制一个可视化状态图;
基于Prometheus配置报警规则(本文此部分略);这里类比PostgreSQL数据库的Exporter实现方法,实现了一个Greenplum的Exporter,项目地址为:
https://github.com/tangyibo/greenplum_exporter
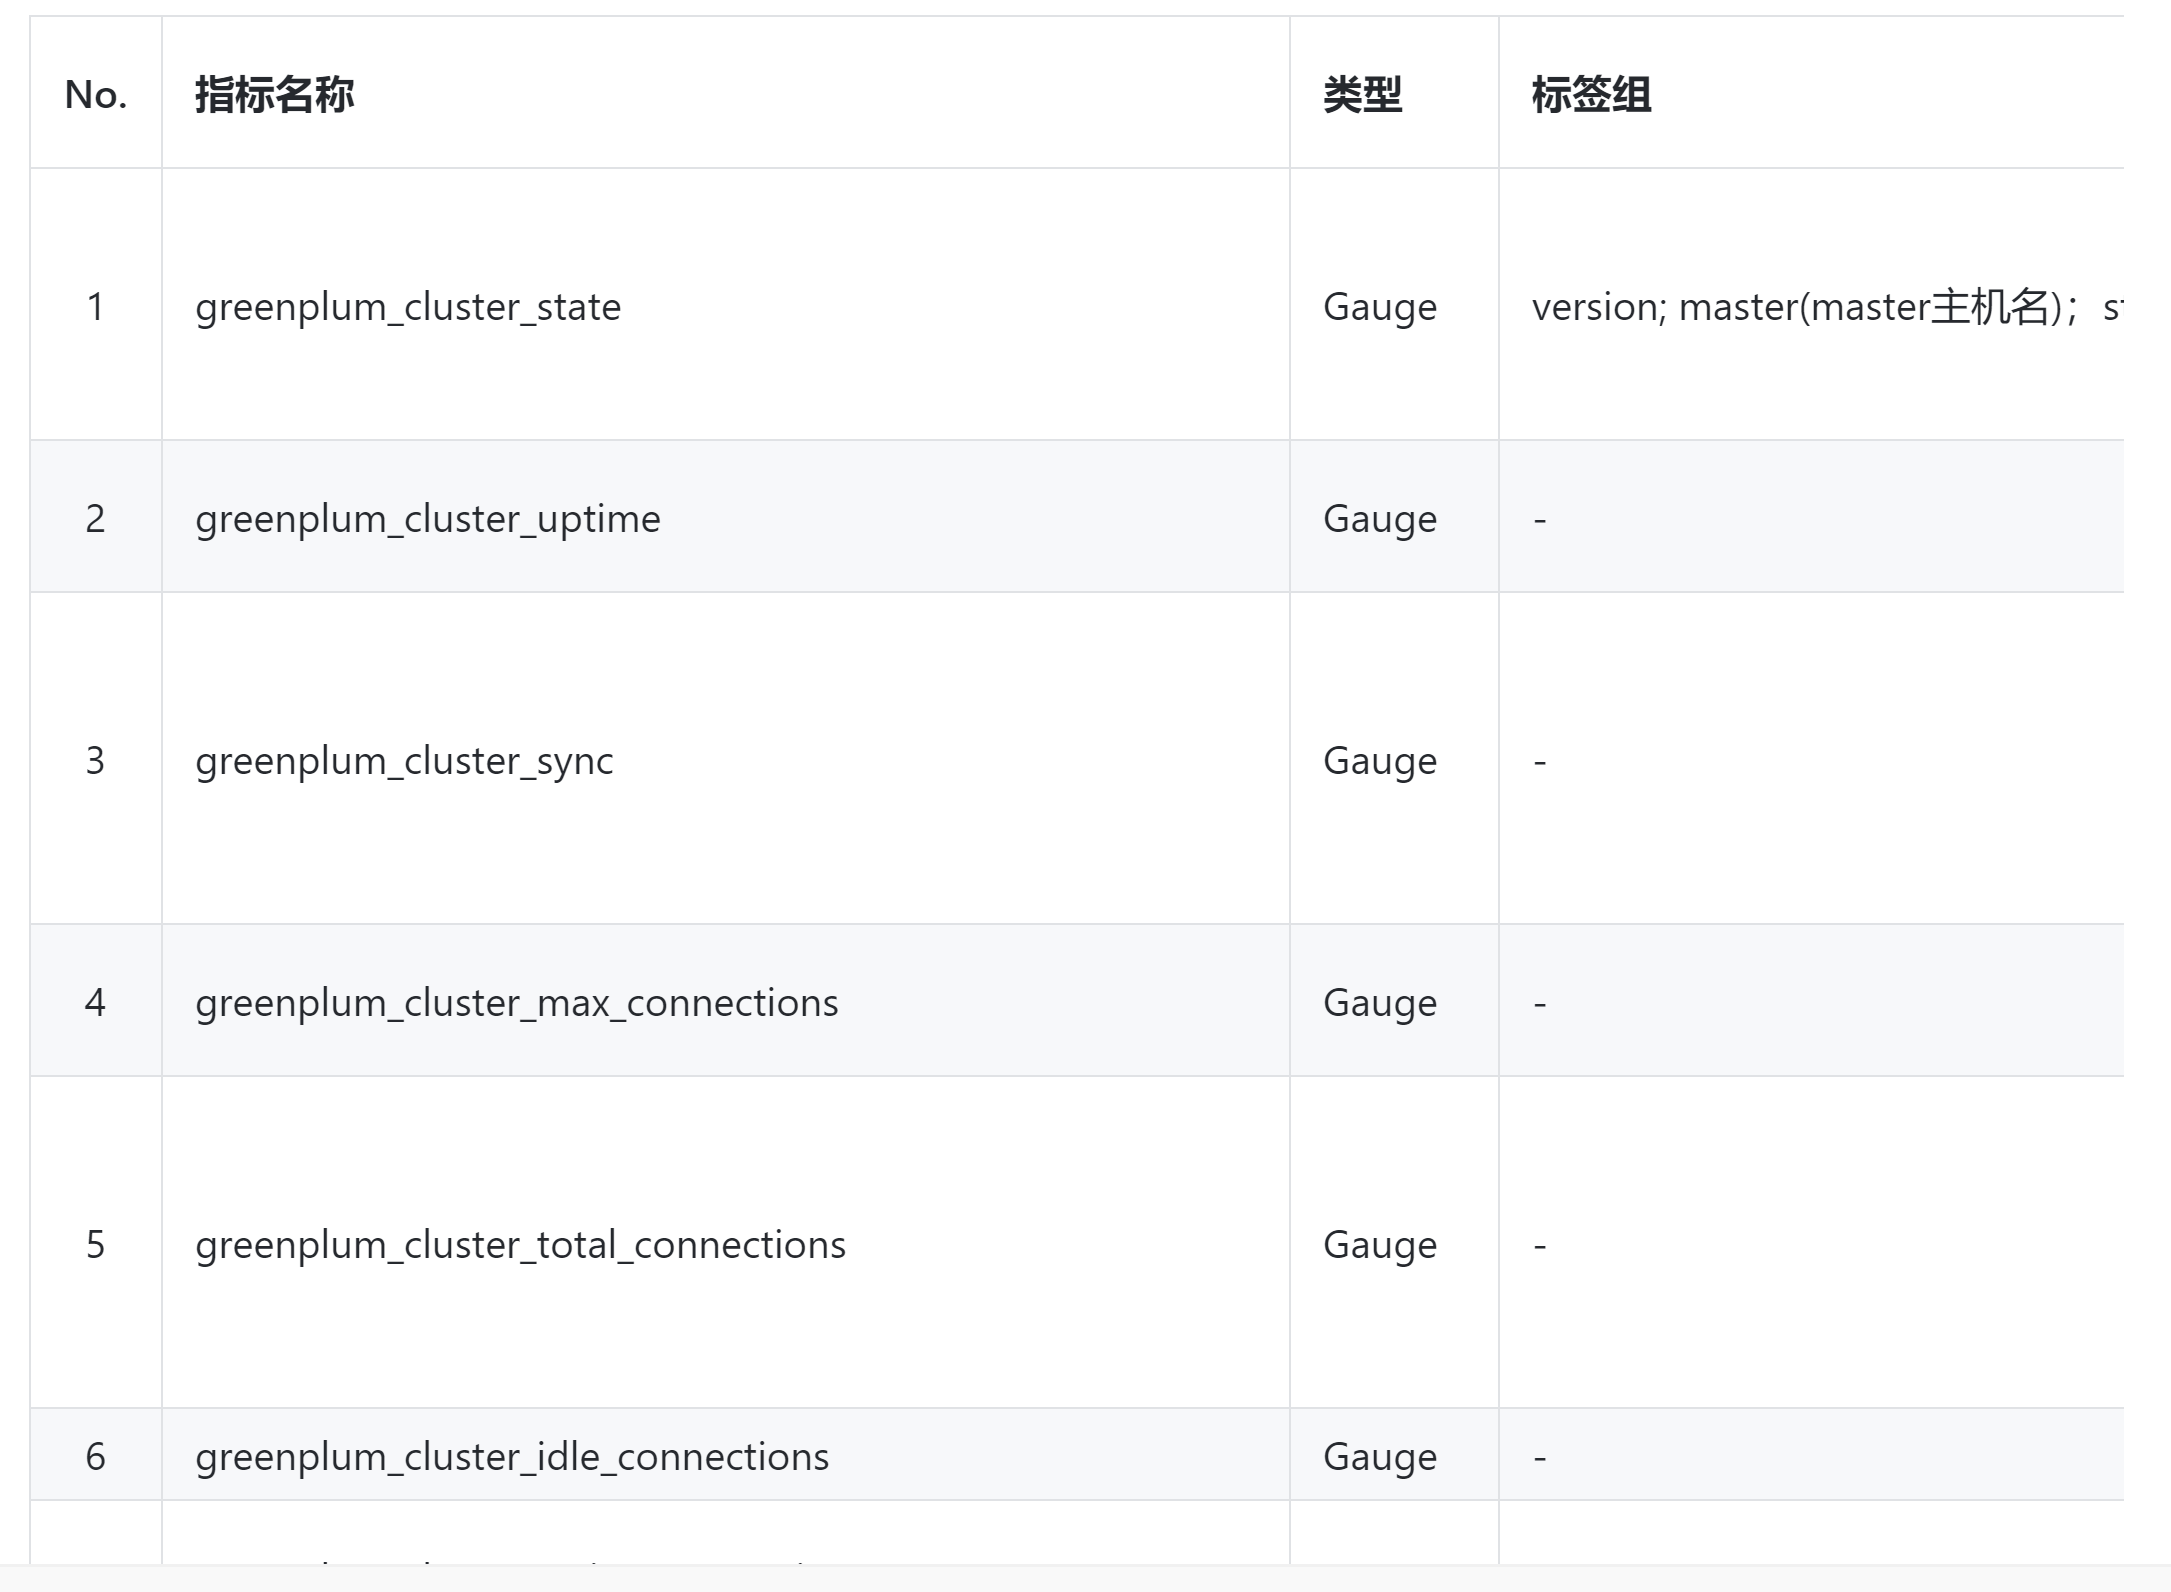
在greenplum_expoter里主要扩展了实现了客户连接信息、账号连接信息、Segment存储信息、集群节点同步状态、数据库锁监控等相关指标,具体指标如下:
Prometheus本身也是一个导出器(exporter),提供了关于内存使用、垃圾收集以及自身性能
与健康状态等各种主机级指标。
prometheus官网下载址:
https://prometheus.io/download/
wget https://github.com/prometheus/prometheus/releases/download/v2.21.0/prometheus-2.21.0.linux-amd64.tar.gz
# tar xf prometheus-2.21.0.linux-amd64.tar.gz
# mv prometheus-2.21.0.linux-amd64 /usr/local/prometheus
# chmod +x /usr/local/prometheus/prom*
# cp -rp /usr/local/prometheus/promtool /usr/bin/
cd /usr/local/prometheus/
vim prometheus.yml
-----
# my global config
global:
scrape_interval: 15s # Set the scrape interval to every 15 seconds. Default is every 1 minute.
evaluation_interval: 15s # Evaluate rules every 15 seconds. The default is every 1 minute.
# scrape_timeout is set to the global default (10s).
# Alertmanager configuration
alerting:
alertmanagers:
- static_configs:
- targets:
# - alertmanager:9093
# Load rules once and periodically evaluate them according to the global ‘evaluation_interval‘.
rule_files:
# - "first_rules.yml"
# - "second_rules.yml"
# A scrape configuration containing exactly one endpoint to scrape:
# Here it‘s Prometheus itself.
scrape_configs:
# The job name is added as a label `job=<job_name>` to any timeseries scraped from this config.
- job_name: ‘prometheus‘
# metrics_path defaults to ‘/metrics‘
# scheme defaults to ‘http‘.
static_configs:
- targets: [‘localhost:9090‘]
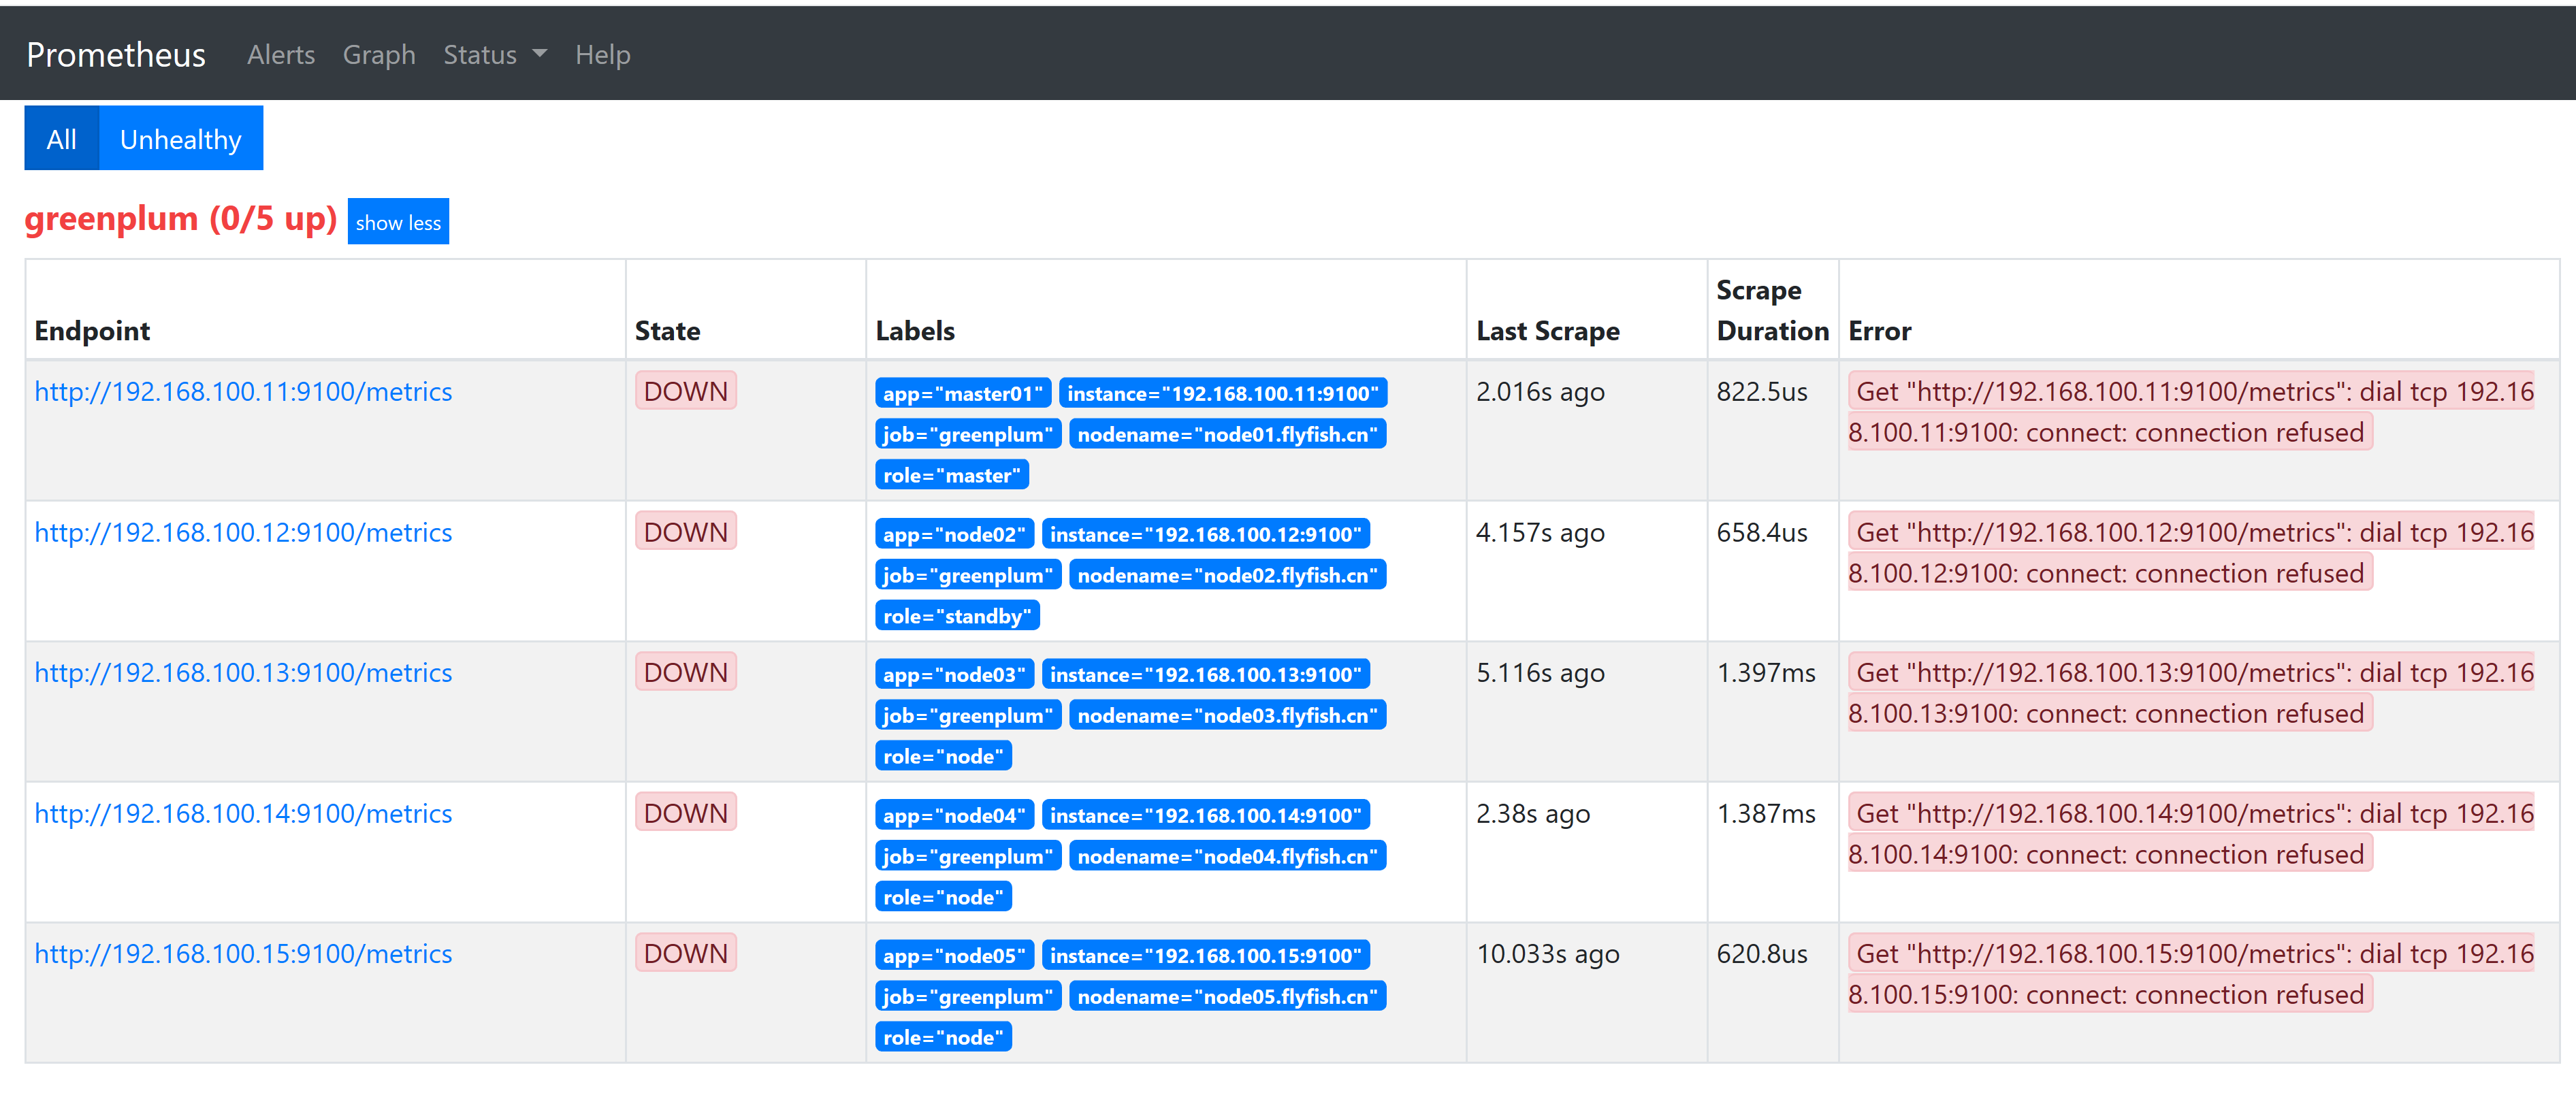
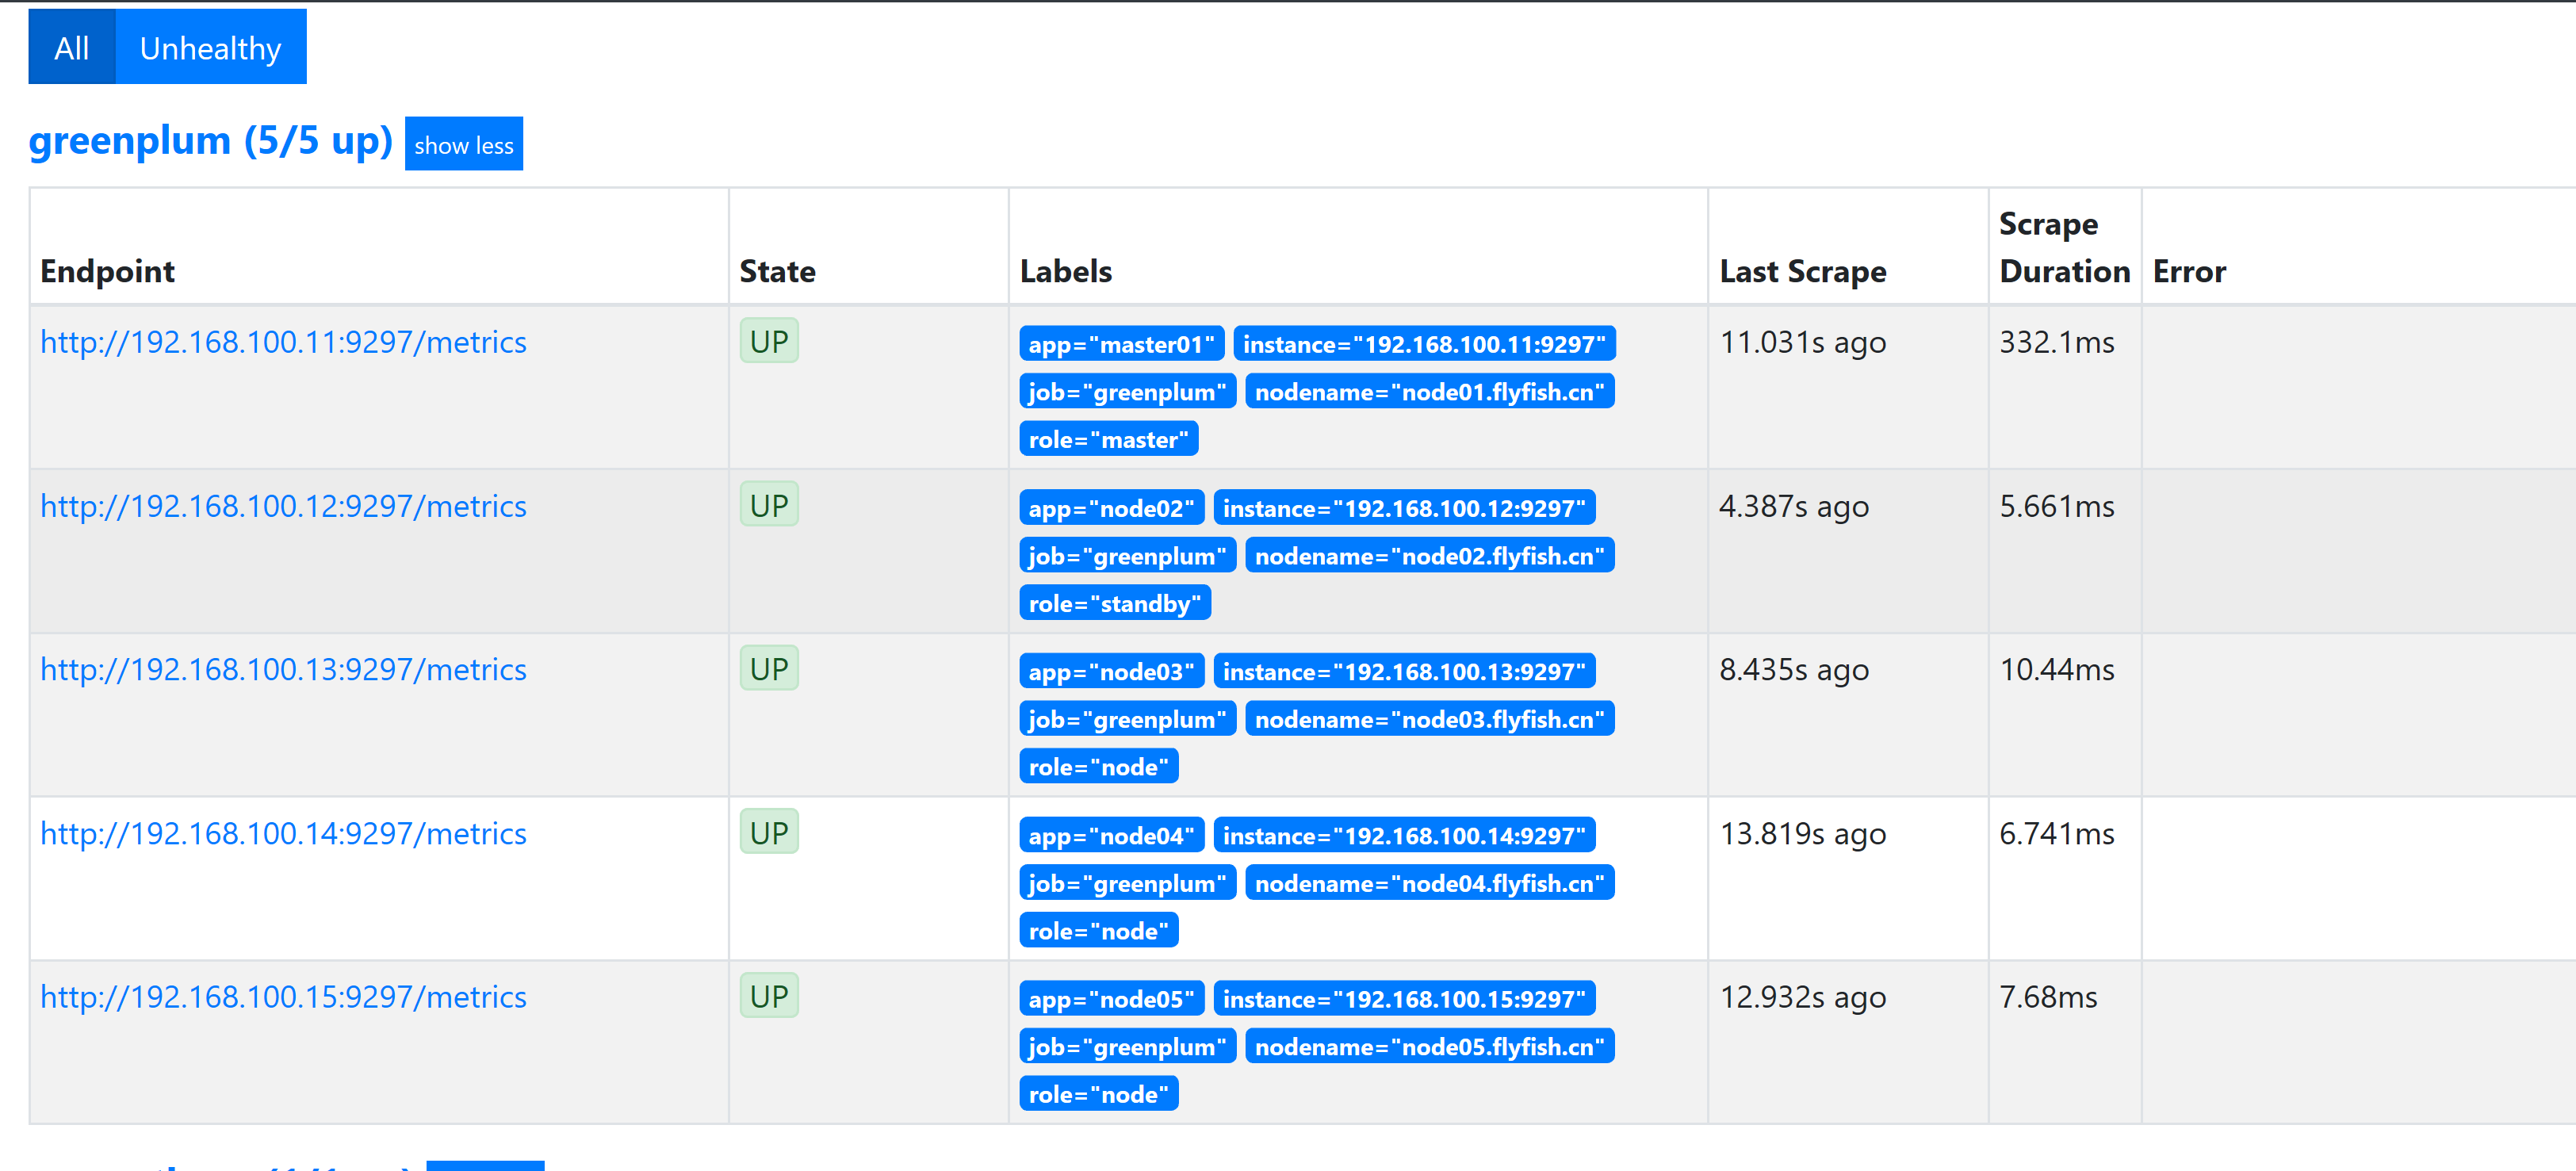
- job_name: ‘greenplum‘
static_configs:
- targets: [‘192.168.100.11:9297‘]
labels:
app: master01
nodename: node01.flyfish.cn
role: master
- targets: [‘192.168.100.12:9297‘]
labels:
app: node02
nodename: node02.flyfish.cn
role: standby
- targets: [‘192.168.100.13:9297‘]
labels:
app: node03
nodename: node03.flyfish.cn
role: node
- targets: [‘192.168.100.14:9297‘]
labels:
app: node04
nodename: node04.flyfish.cn
role: node
- targets: [‘192.168.100.15:9297‘]
labels:
app: node05
nodename: node05.flyfish.cn
role: node
-----启动:
cd /usr/local/prometheus/
./prometheus --config.file=prometheus.yml &
1、下载安装包

wget https://github.com.cnpmjs.org/tangyibo/greenplum_exporter/releases/download/1.0/greenplum_exporter-1.0-1.x86_64.rpm

rpm -ivh greenplum_exporter-1.0-1.x86_64.rpm
2、配置数据库连接
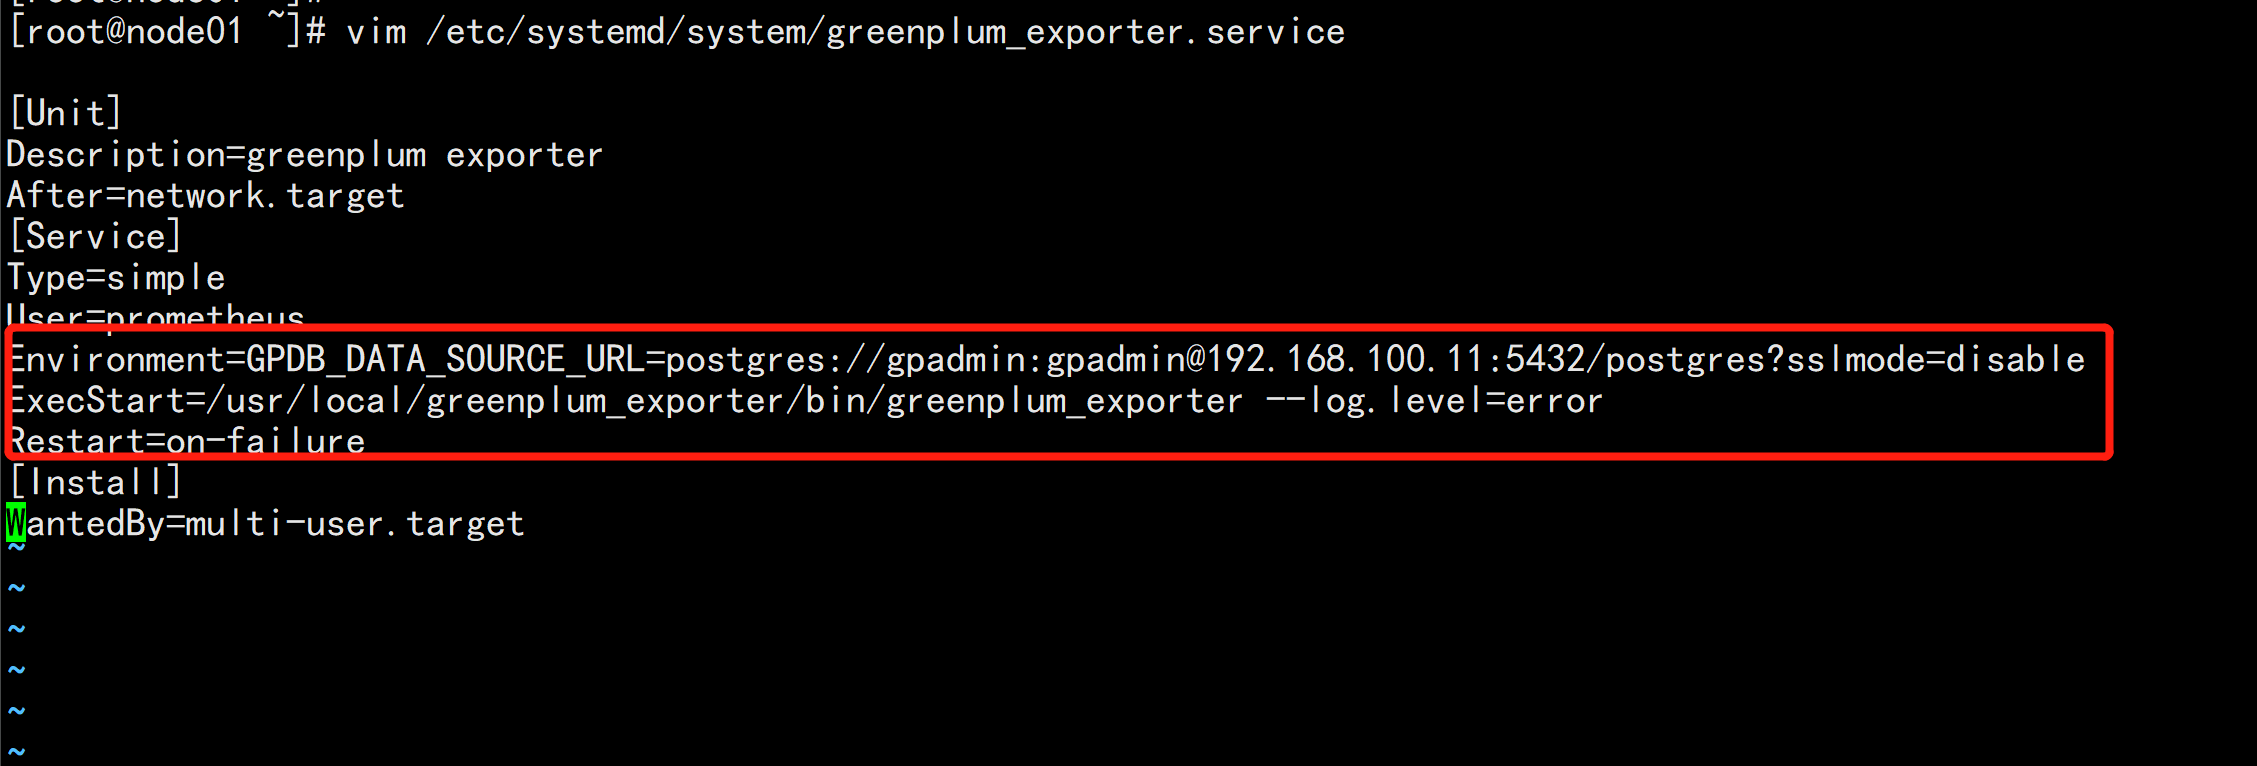
修改vim /etc/systemd/system/greenplum_exporter.service文件中配置的greenplum数据库服务器的地址和gpadmin账号的密码。
----
[Unit]
Description=greenplum exporter
After=network.target
[Service]
Type=simple
User=prometheus
Environment=GPDB_DATA_SOURCE_URL=postgres://gpadmin:gpadmin@192.168.100.11:5432/postgres?sslmode=disable
ExecStart=/usr/local/greenplum_exporter/bin/greenplum_exporter --log.level=error
Restart=on-failure
[Install]
WantedBy=multi-user.target
----
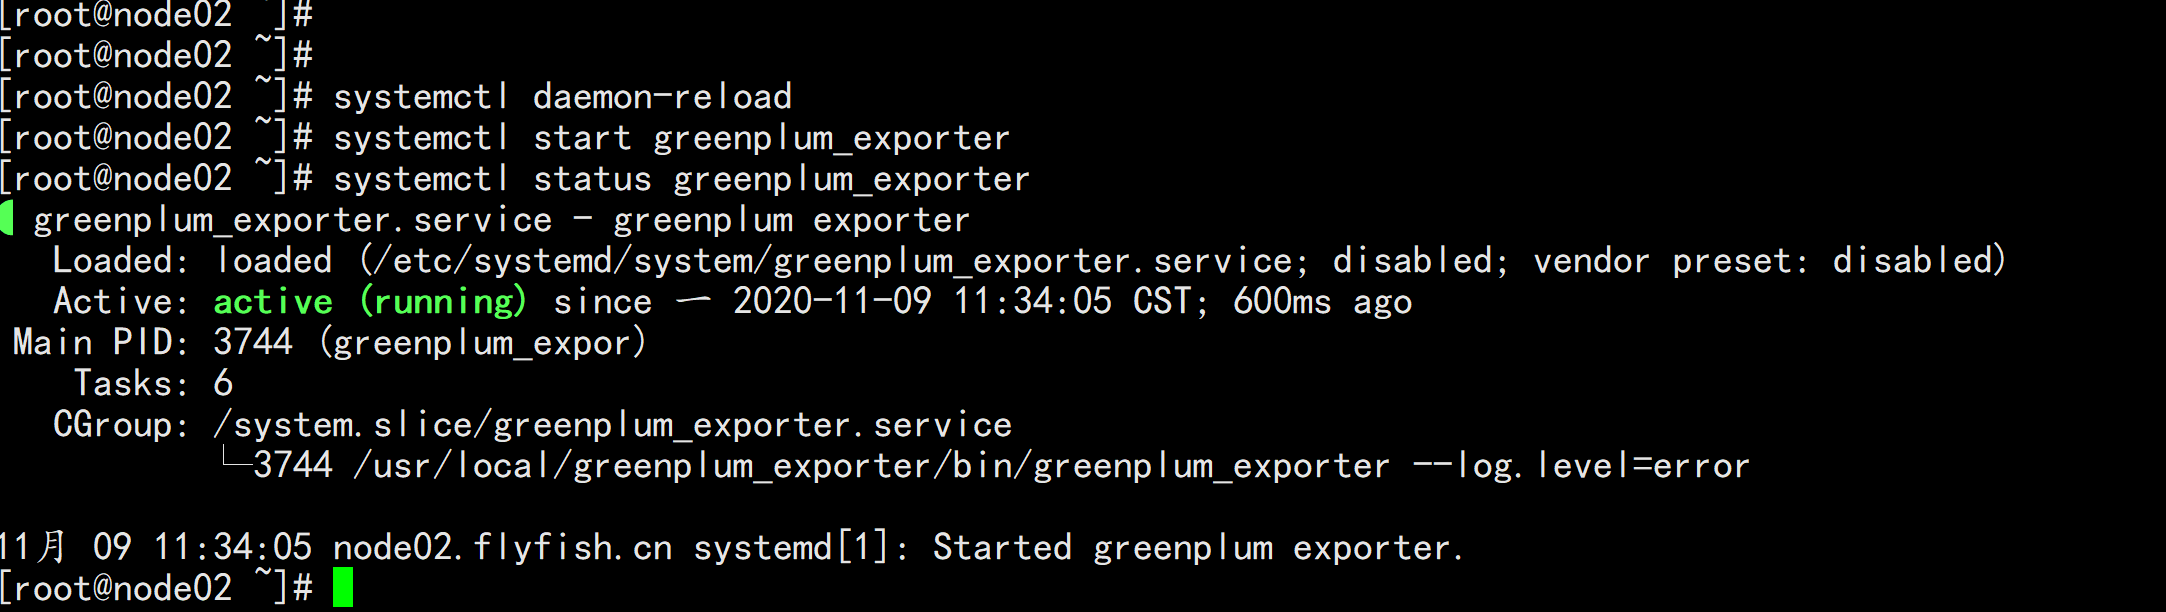
启动Expoter程序
----
systemctl daemon-reload
systemctl start greenplum_exporter
systemctl status greenplum_exporter
----
重启:promethues

ps -ef |grep promethus

kill -9 3121

./prometheus --config.file=prometheus.yml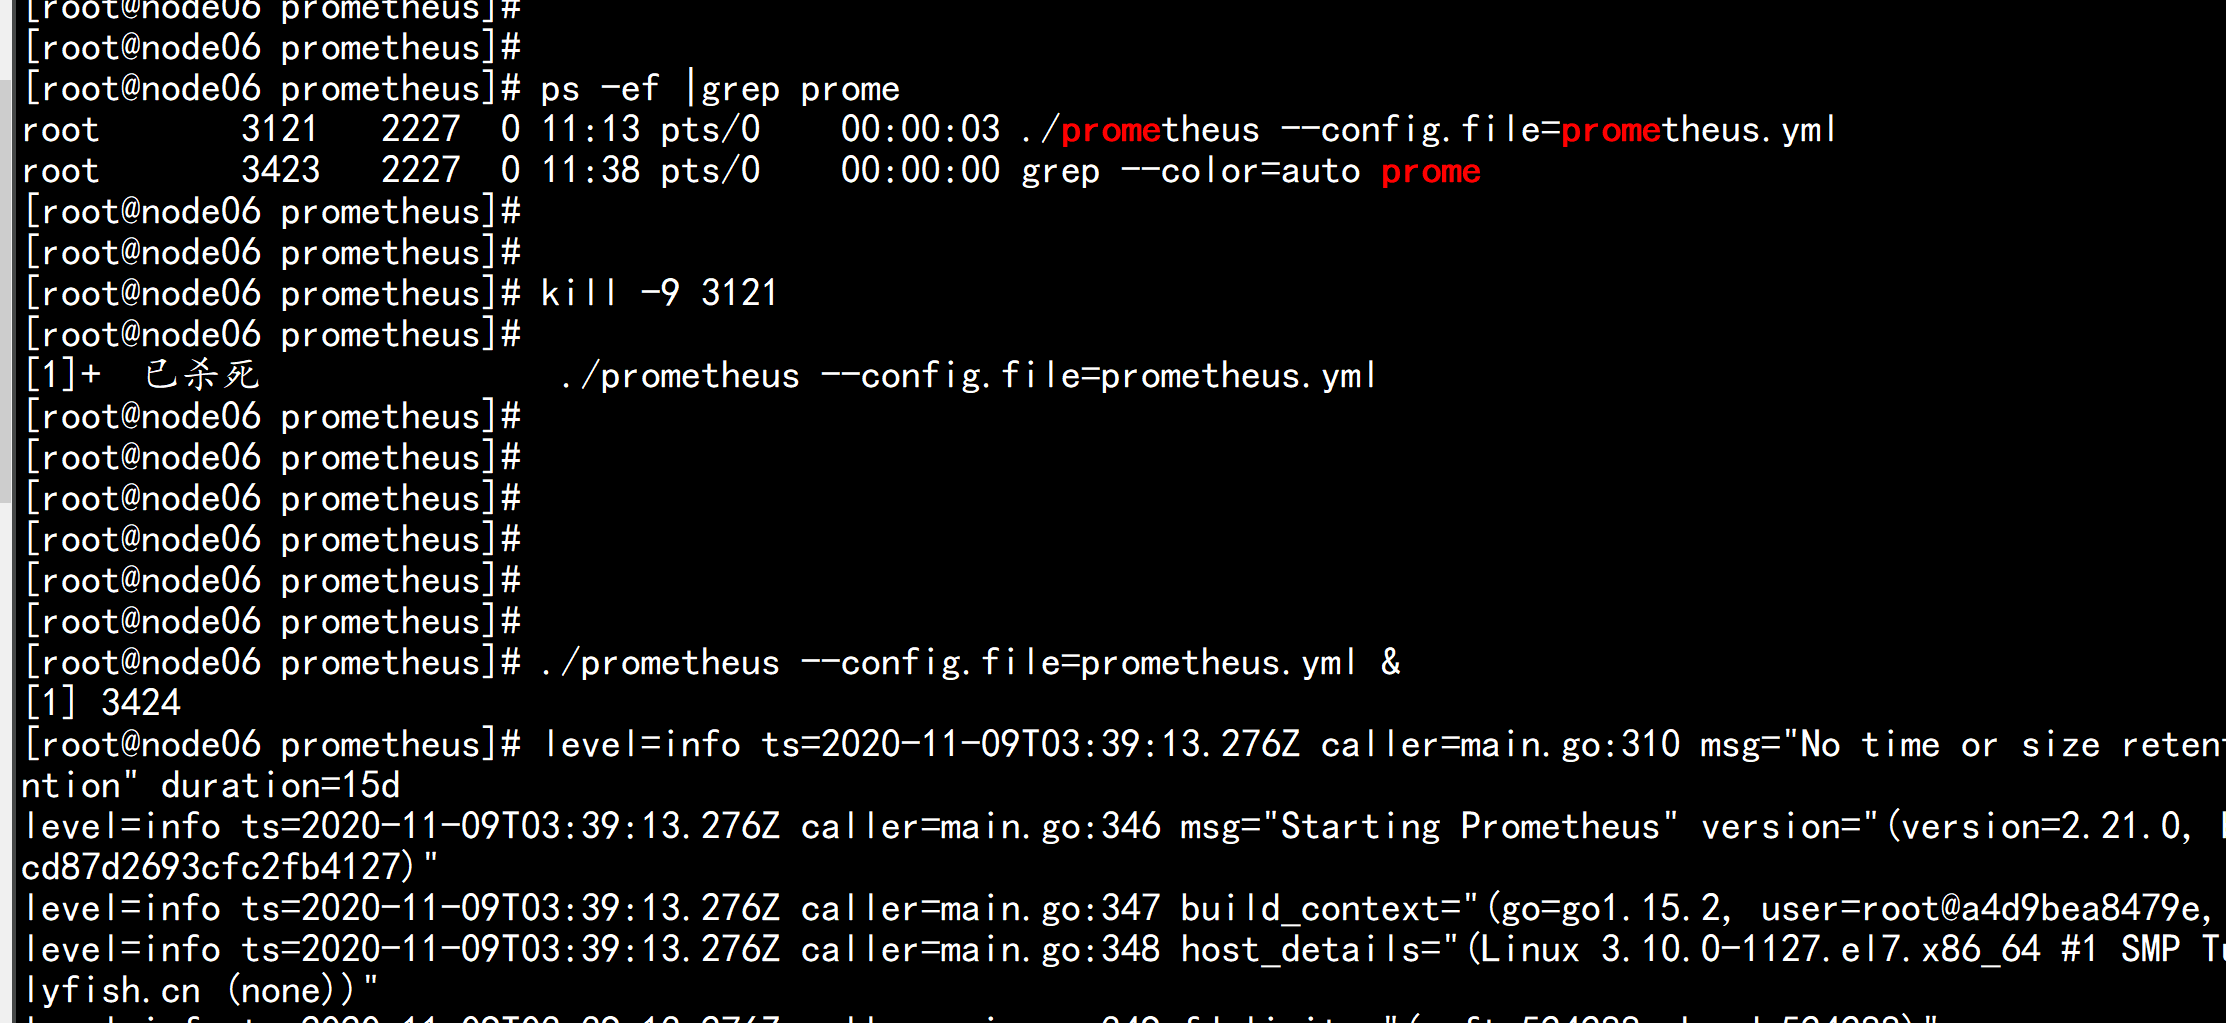
1、下载:

wget https://dl.grafana.com/oss/release/grafana-7.1.5-1.x86_64.rpm

rpm -ivh grafana-7.1.5-1.x86_64.rpm

systemctl start grafana-server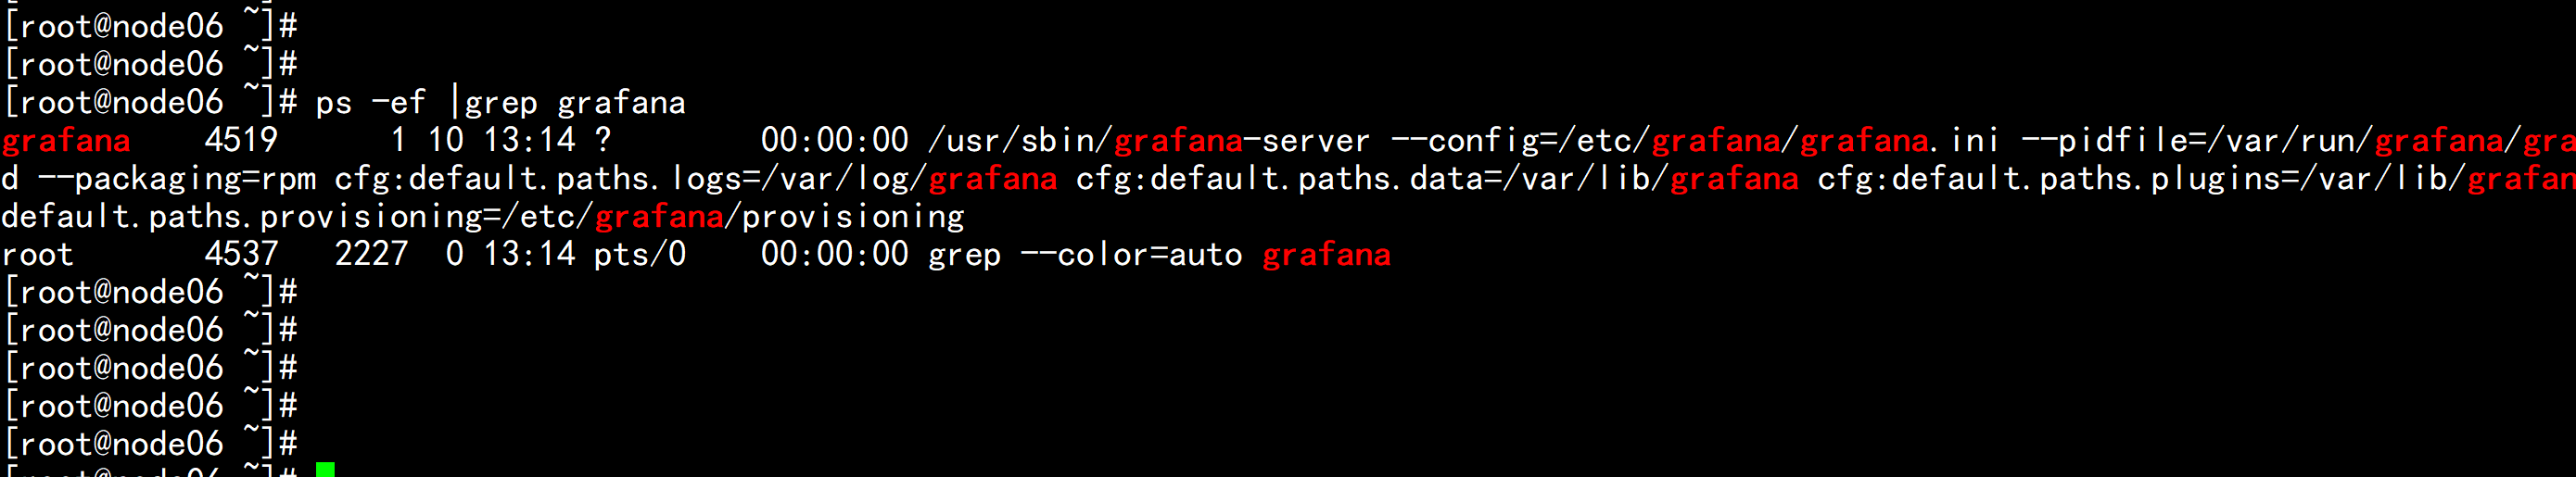
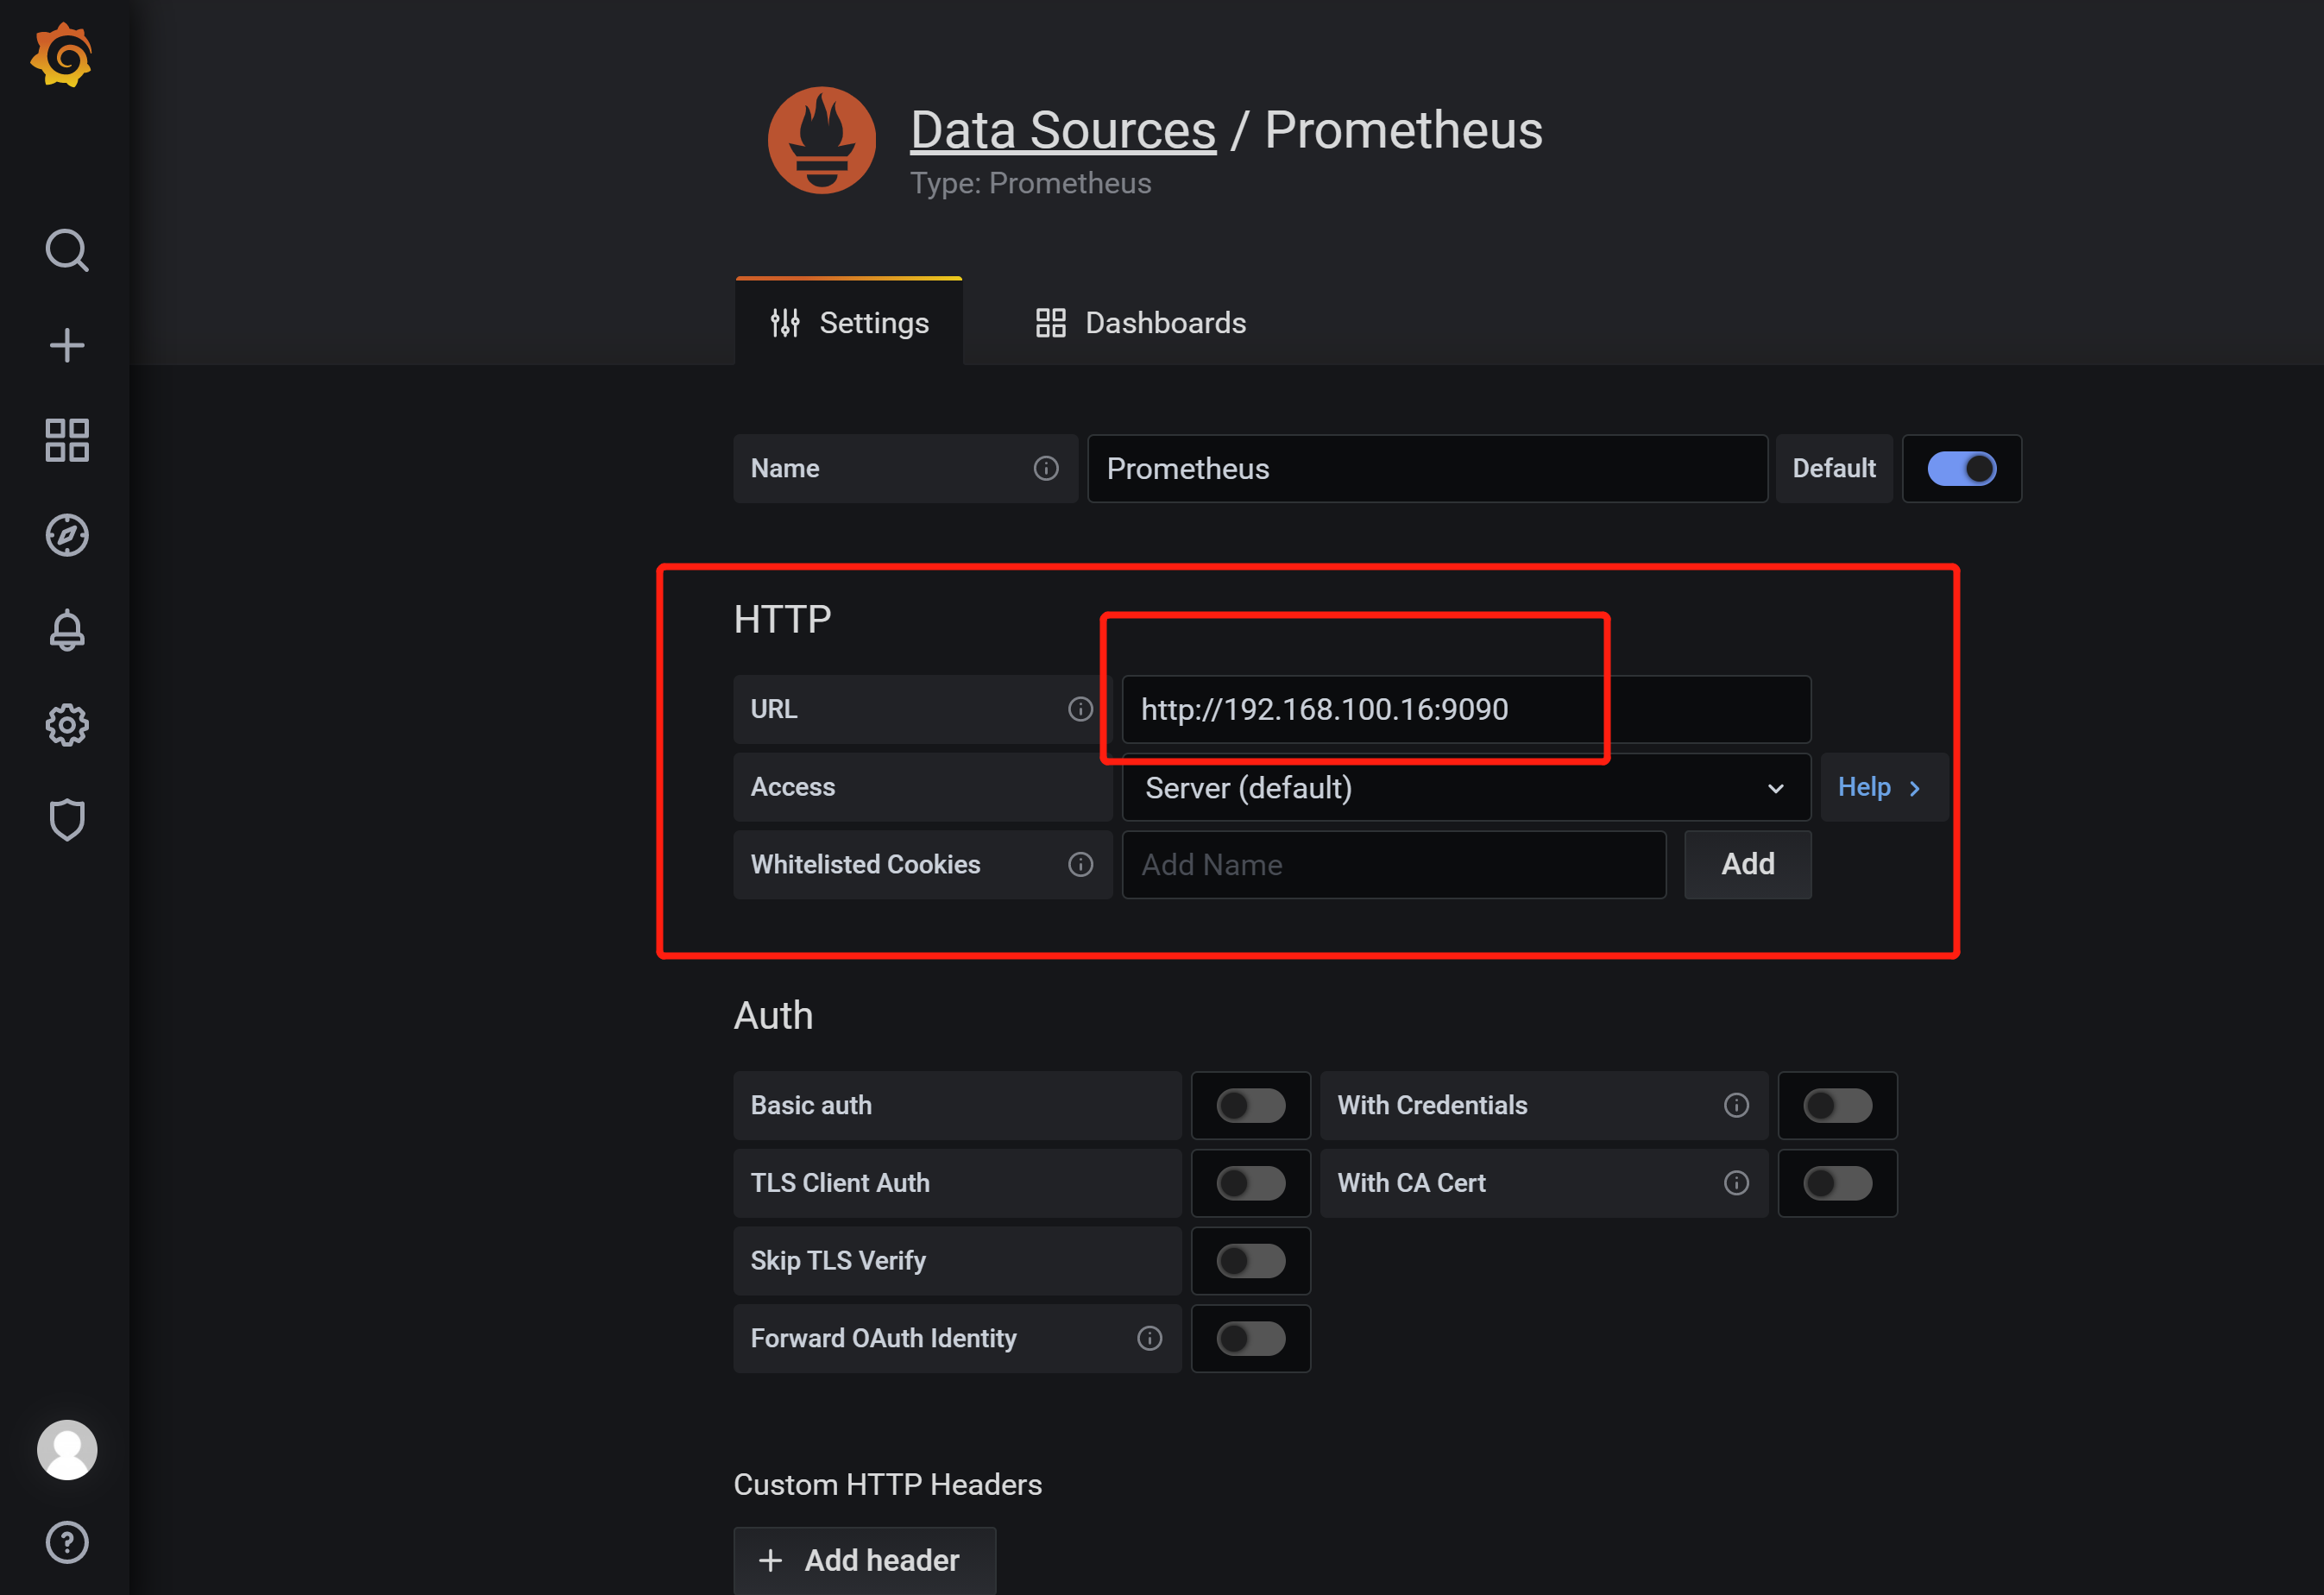
5、访问

访问地址:http://192.168.100.16:3000

用户名:admin

密码:admin
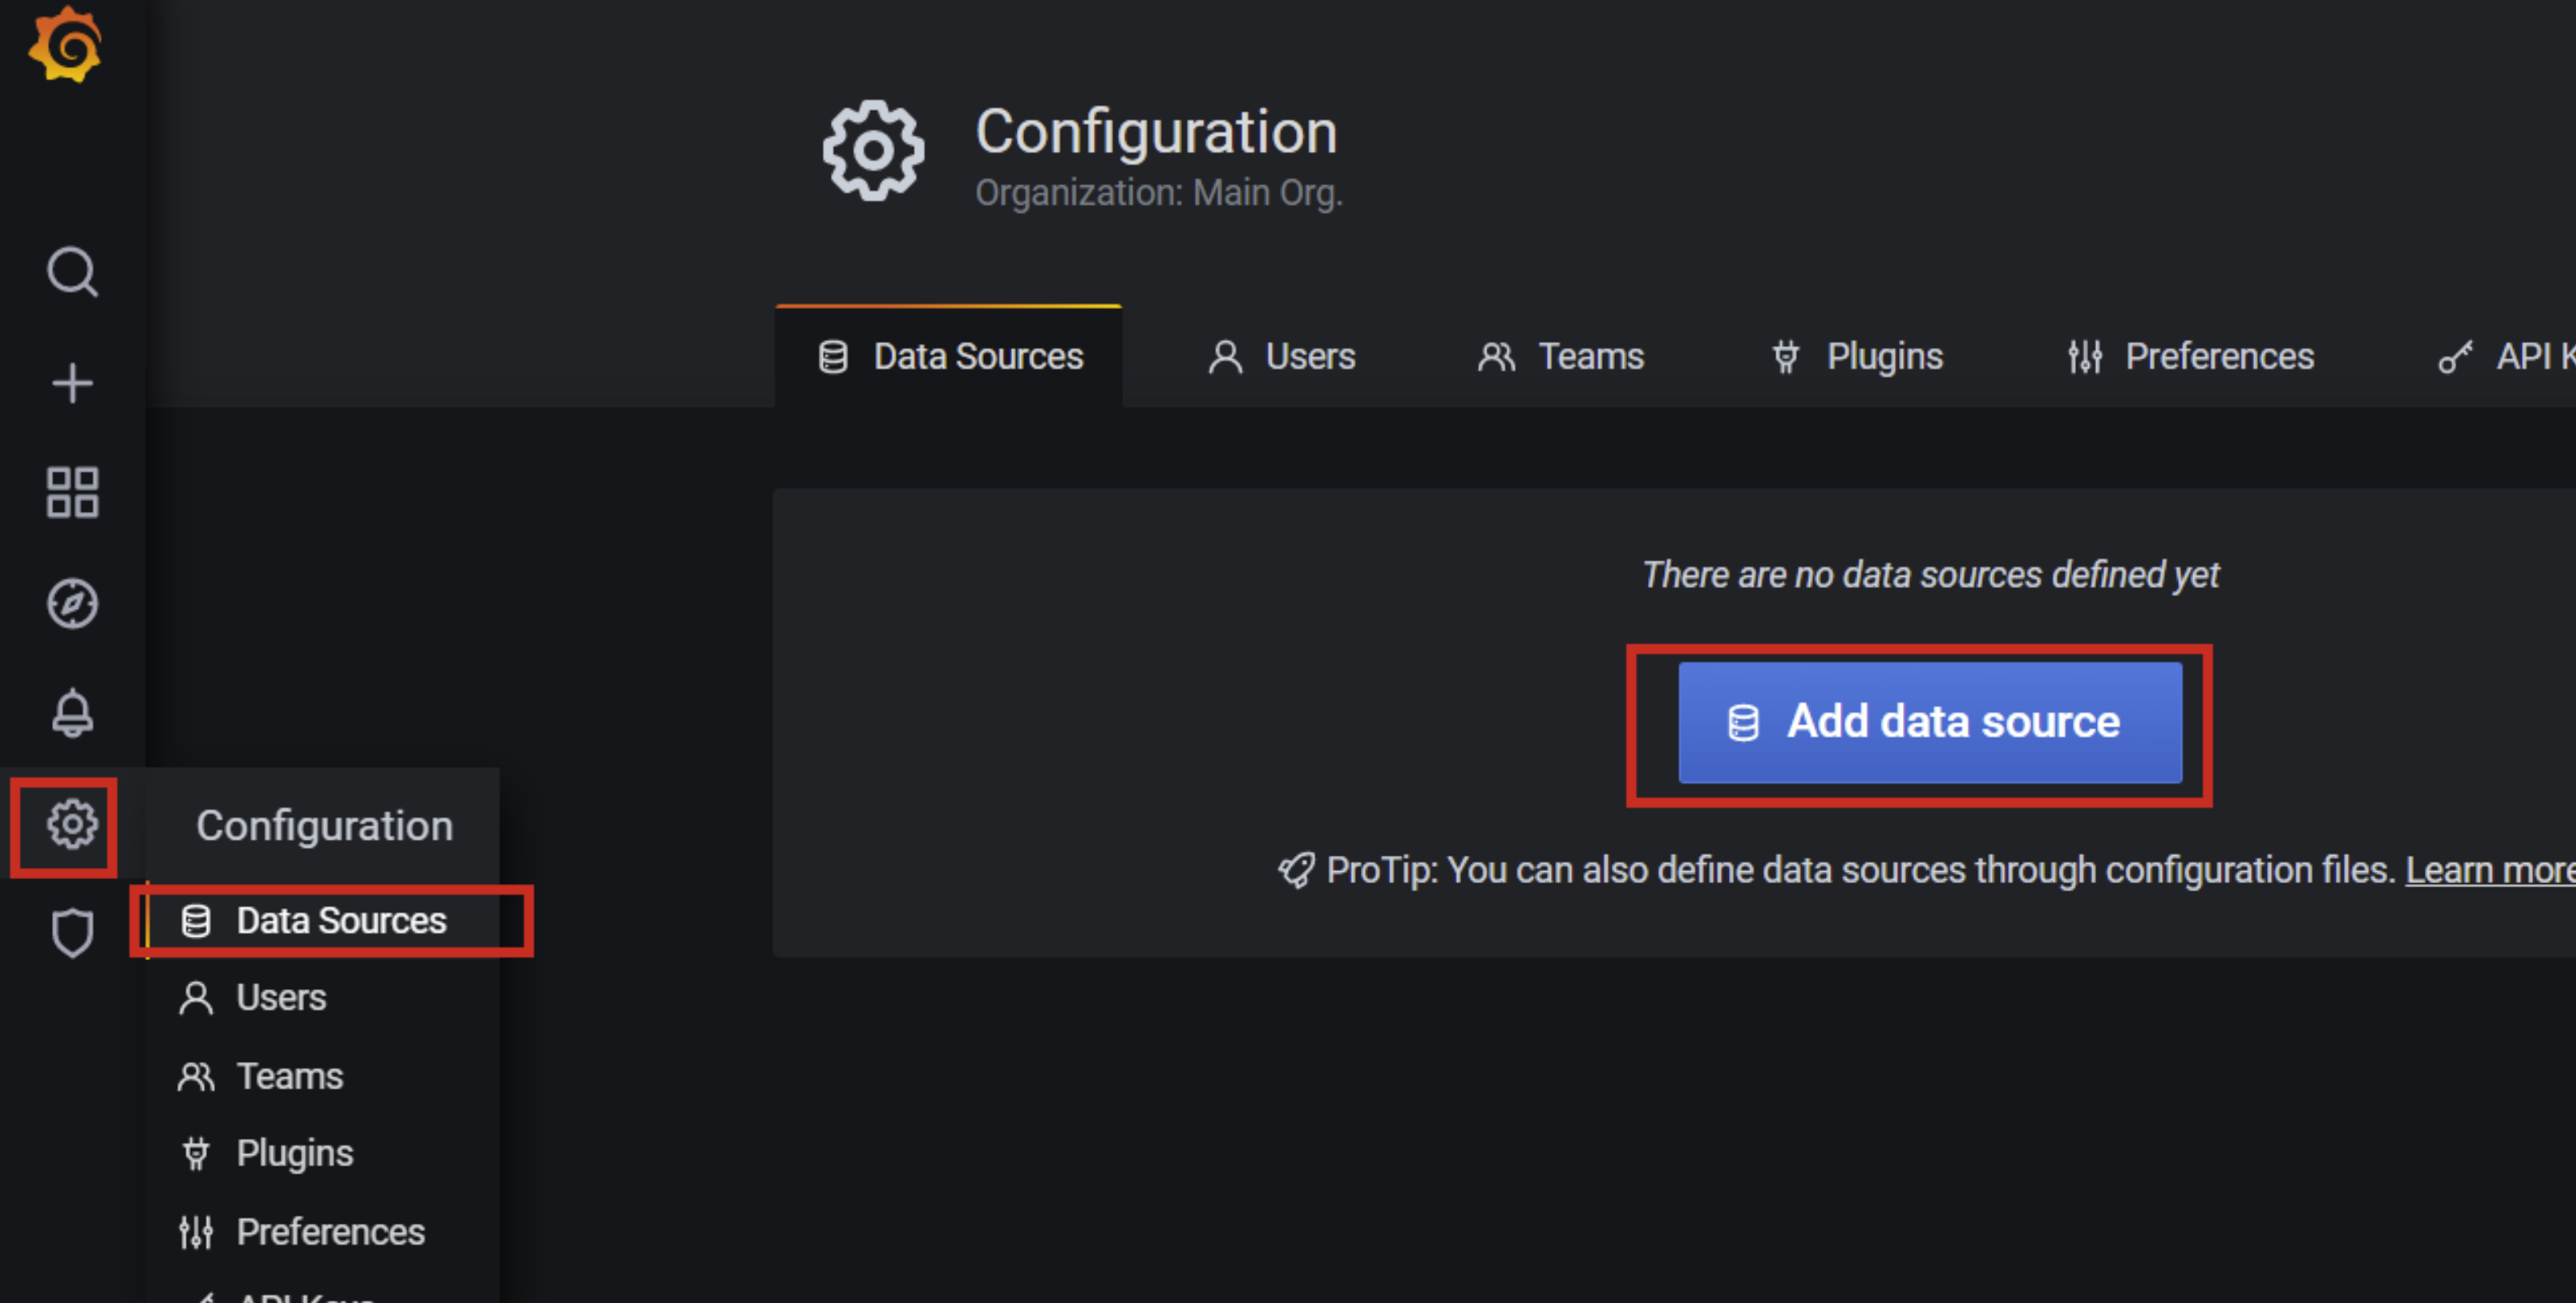
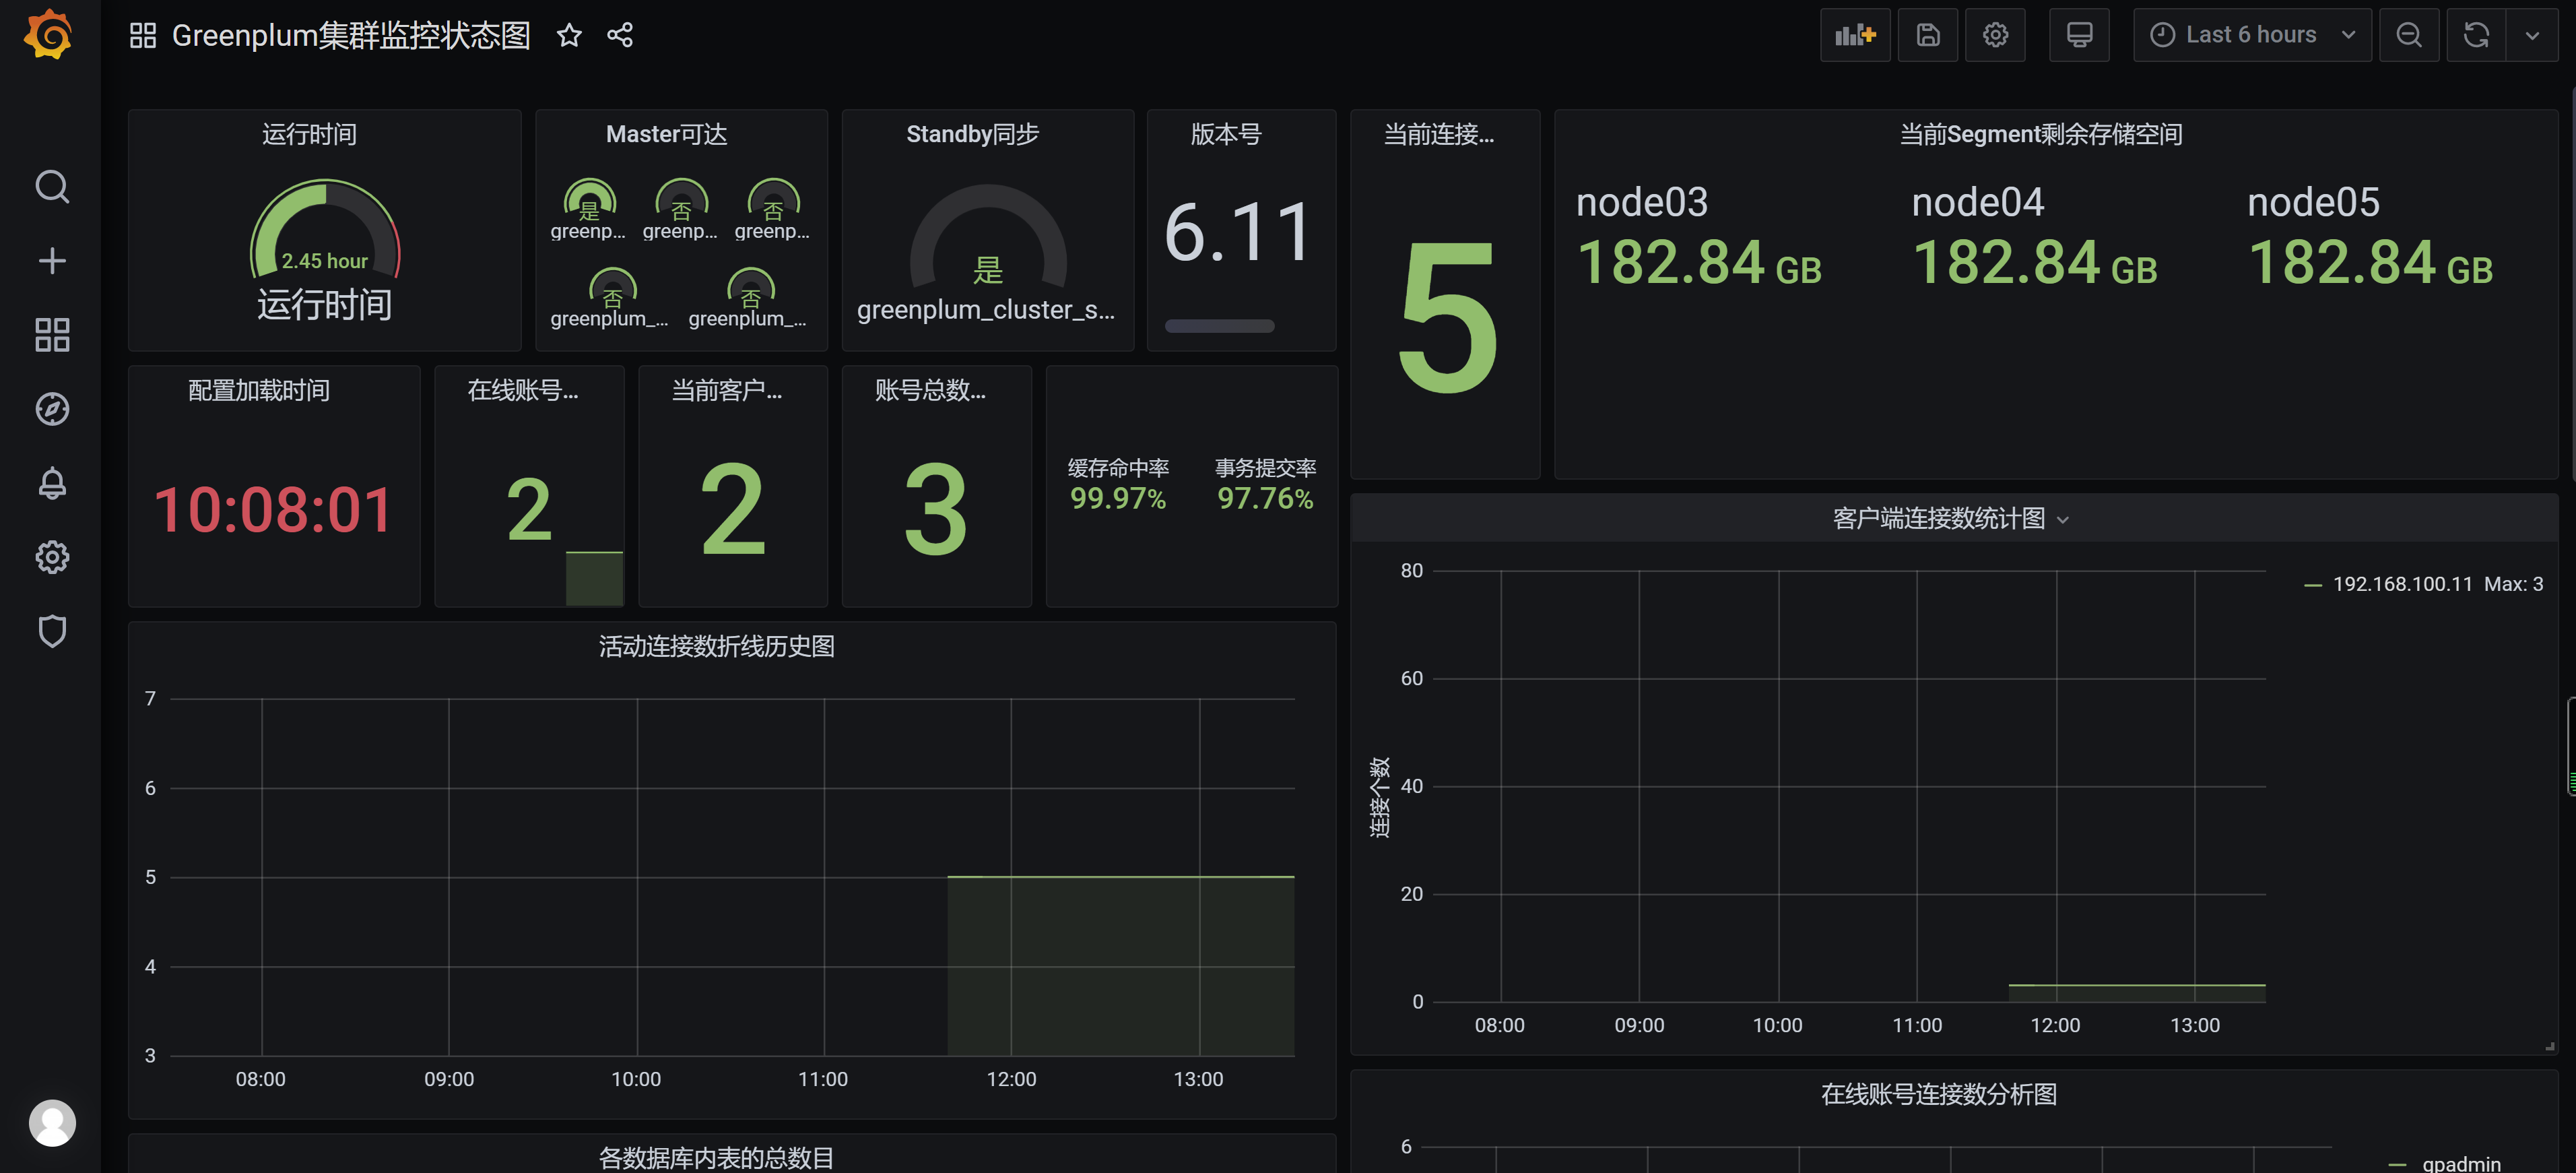
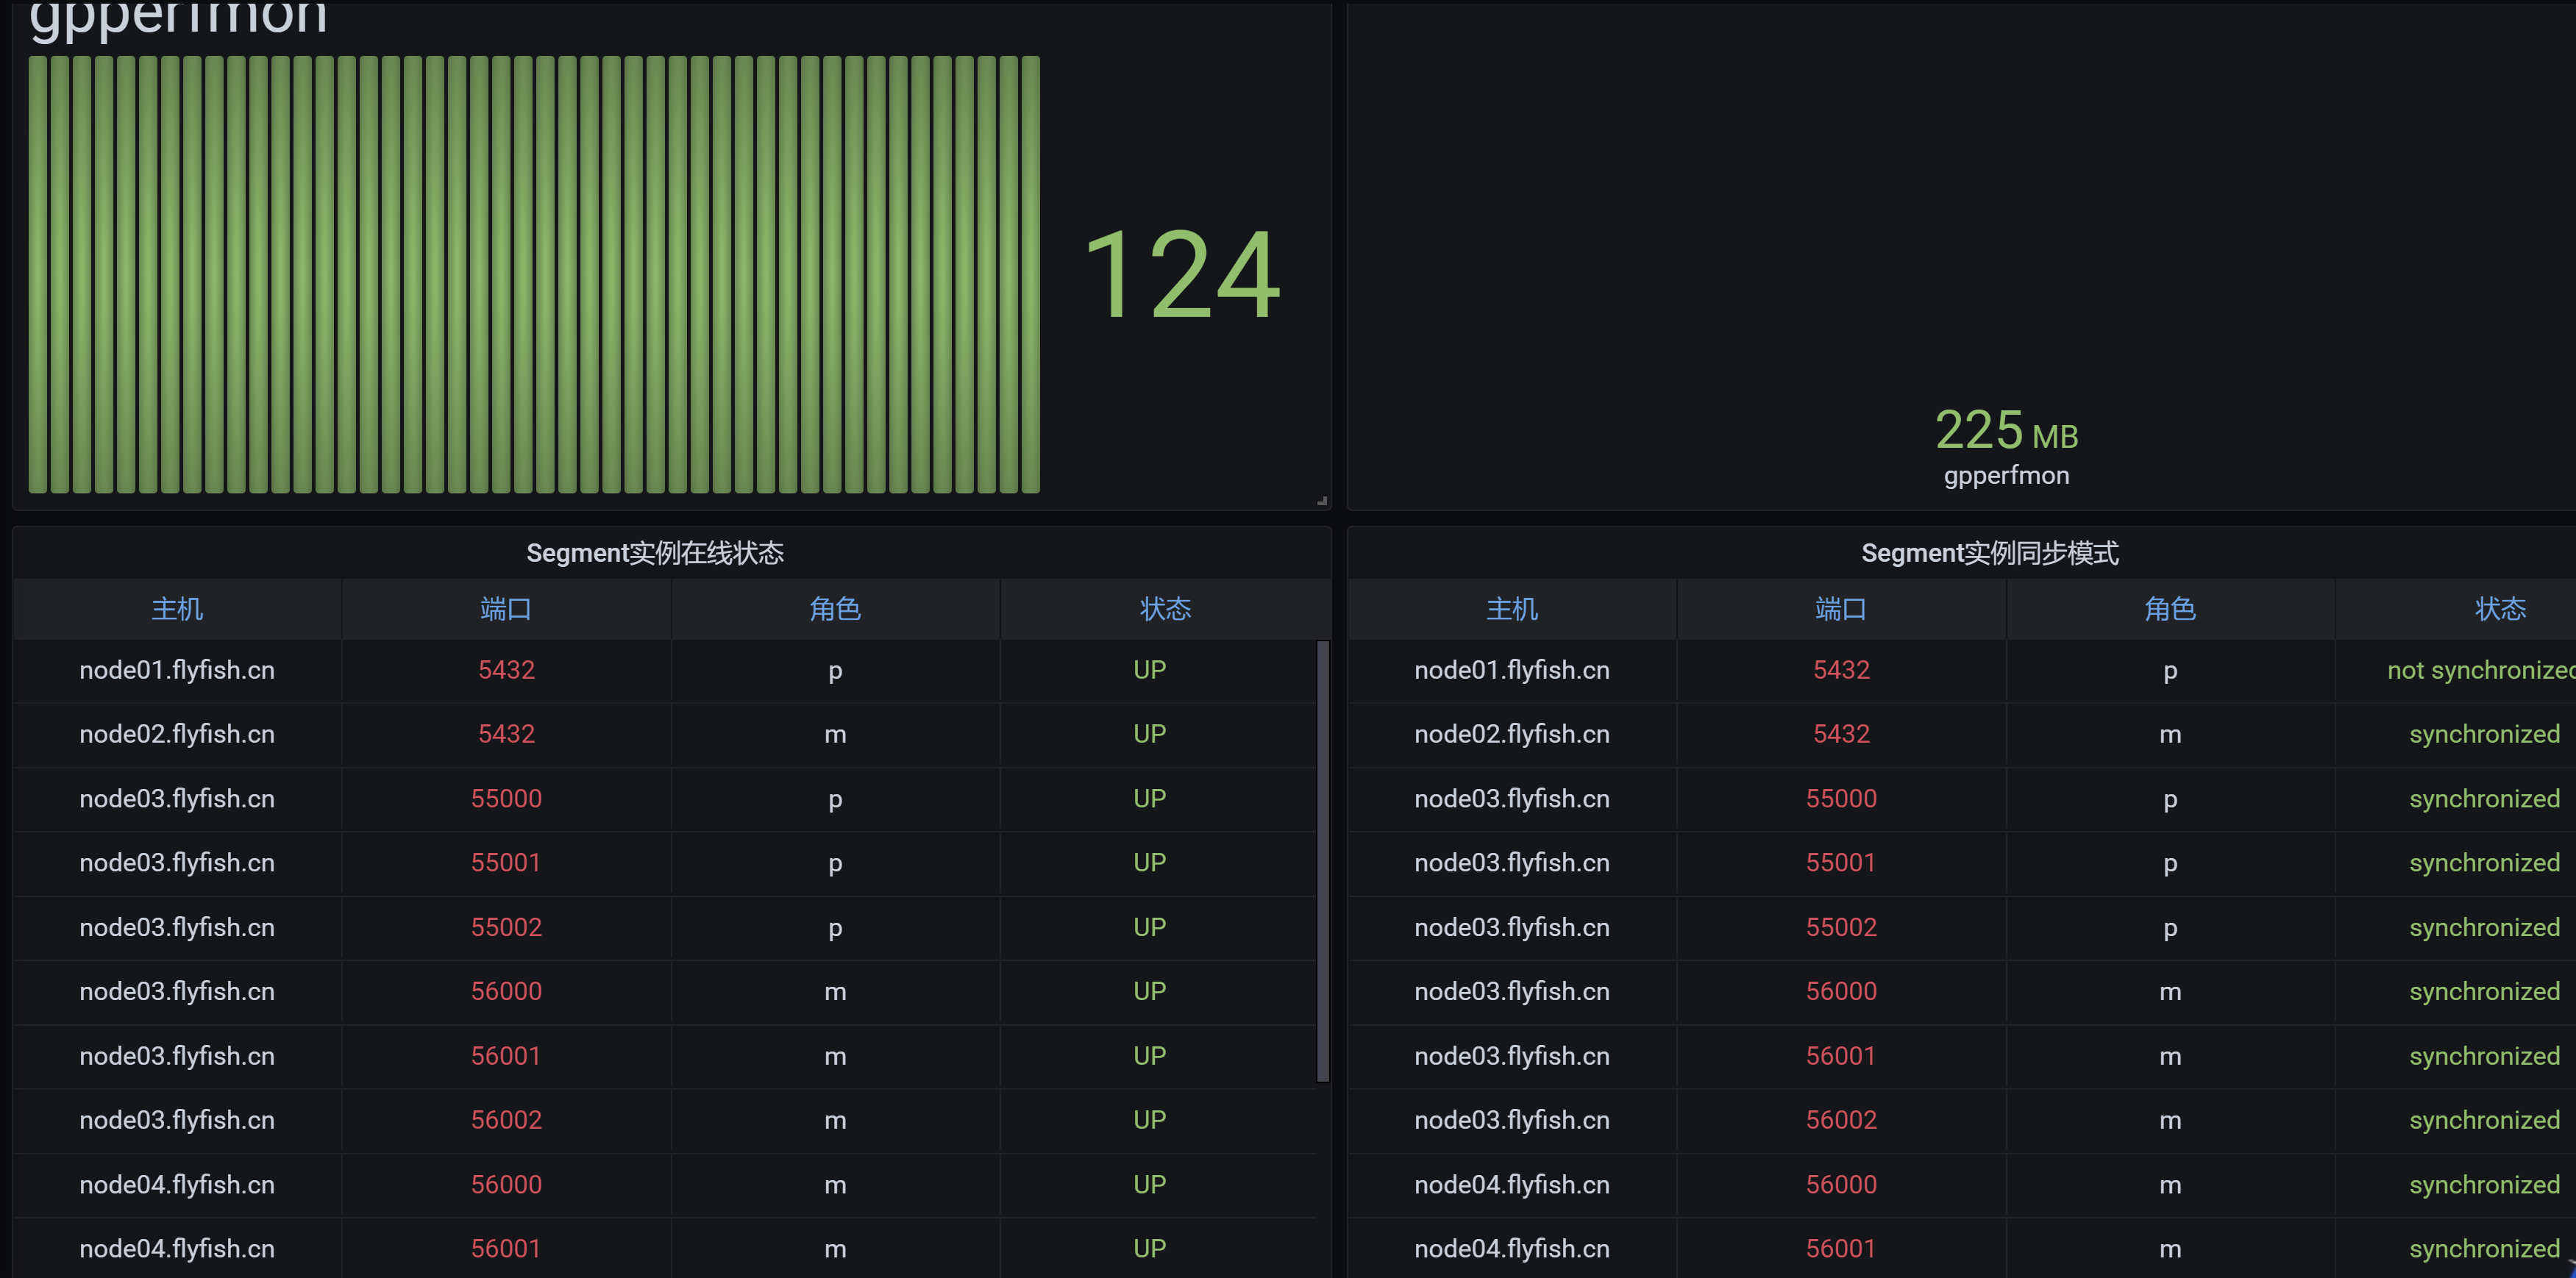
使用Grafana绘制一个可视化状态图
根据以上监测指标,即可使用Grafana配置图像了,具体内容请见:
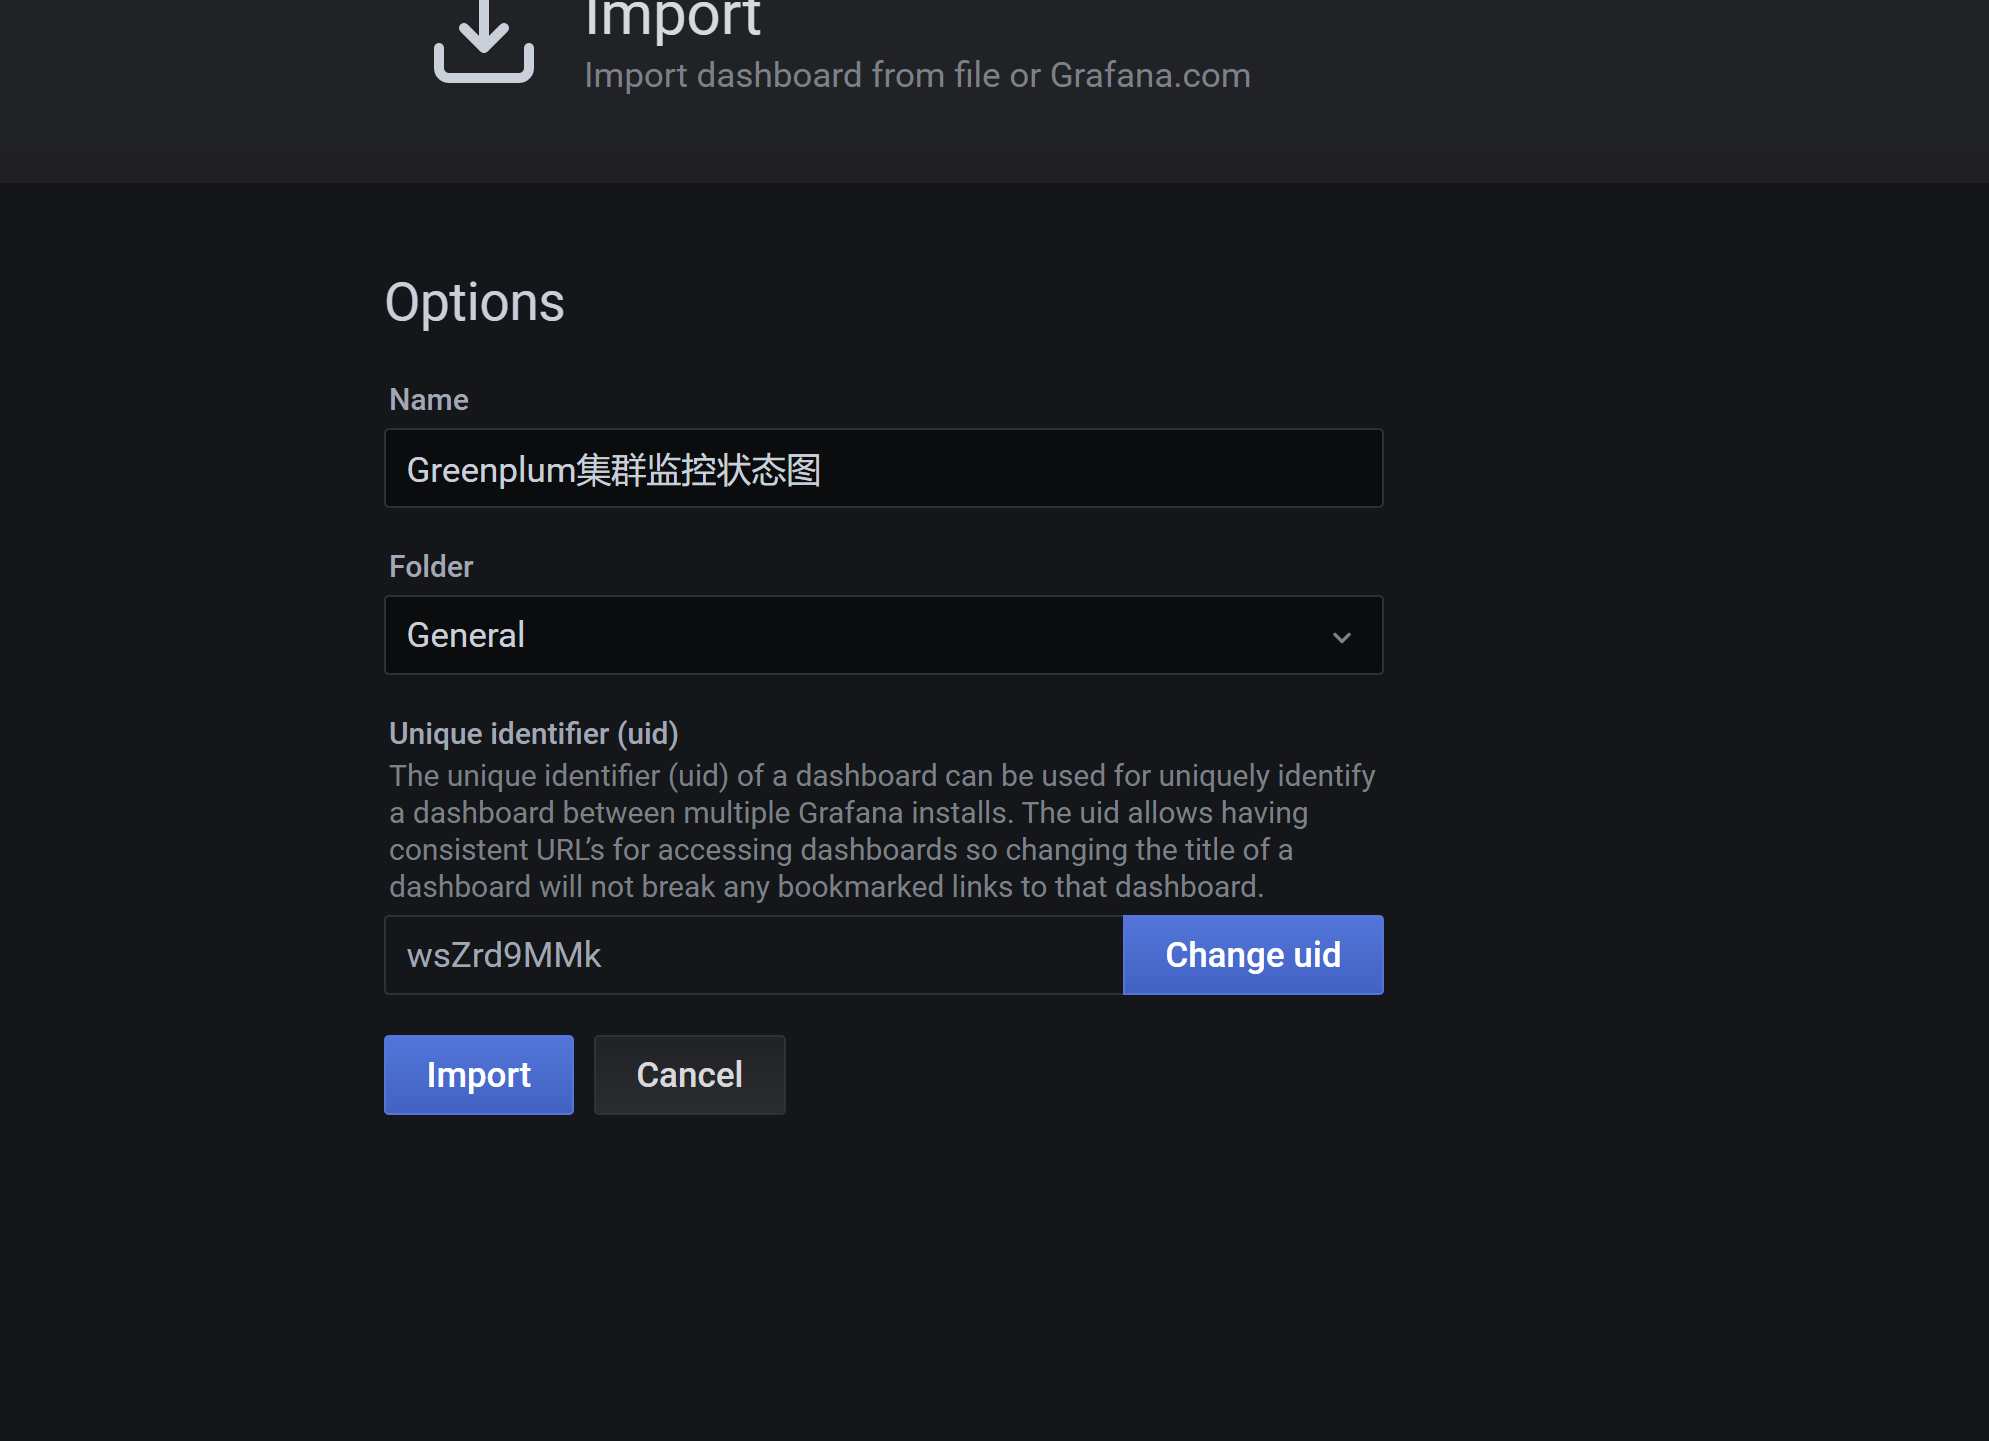
将下面中的数据
https://github.com/tangyibo/greenplum_exporter/blob/master/grafana/greenplum_dashboard.json
中配置的内容粘贴到上图红色框框内,点击load按钮加载。
基于Promethues与Grafana的Greenplum分布式数据库监控的实现
标签:reload elf emd 垃圾 npm zha l数据库 ima imp
原文地址:https://blog.51cto.com/flyfish225/2558951