标签:apt order eps ddl ilo tput one targe ram
DBSCAN for Outlier Detection
Important DBSCAN model parameters:
import pandas as pd

import matplotlib.pyplot as plt
from pylab import rcParams
import seaborn as sb

import sklearn
from sklearn.cluster import DBSCAN
from collections import Counter
%matplotlib inline
rcParams[‘figure.figsize‘] = 5, 4
sb.set_style(‘whitegrid‘)
# with this example, we‘re going to use the same data that we used for the rest of this chapter. So we‘re going to copy and
# paste in the code.
address = ‘~/Data/iris.data.csv‘
df = pd.read_csv(address, header=None, sep=‘,‘)

df.columns=[‘Sepal Length‘,‘Sepal Width‘,‘Petal Length‘,‘Petal Width‘, ‘Species‘]

data = df.iloc[:,0:4].values
target = df.iloc[:,4].values

df[:5]
| Sepal Length | Sepal Width | Petal Length | Petal Width | Species | |
|---|---|---|---|---|---|
| 0 | 5.1 | 3.5 | 1.4 | 0.2 | setosa |
| 1 | 4.9 | 3.0 | 1.4 | 0.2 | setosa |
| 2 | 4.7 | 3.2 | 1.3 | 0.2 | setosa |
| 3 | 4.6 | 3.1 | 1.5 | 0.2 | setosa |
| 4 | 5.0 | 3.6 | 1.4 | 0.2 | setosa |
model = DBSCAN(eps=0.8, min_samples=19).fit(data)
print(model)
DBSCAN(eps=0.8, min_samples=19)
outliers_df = pd.DataFrame(data)

print(Counter(model.labels_))

print(outliers_df[model.labels_==-1])
Counter({1: 94, 0: 50, -1: 6})
       0    1    2    3
98   5.1  2.5  3.0  1.1
105  7.6  3.0  6.6  2.1
117  7.7  3.8  6.7  2.2
118  7.7  2.6  6.9  2.3
122  7.7  2.8  6.7  2.0
131  7.9  3.8  6.4  2.0
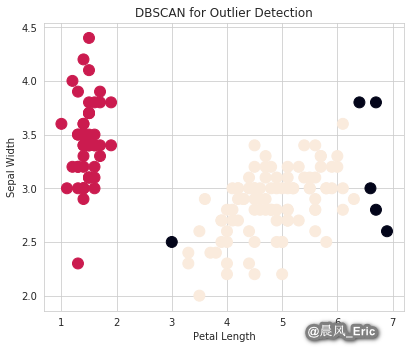
fig = plt.figure()
ax = fig.add_axes([.1,.1,1,1])

colors = model.labels_

ax.scatter(data[:,2],data[:,1],c=colors,s=120)
ax.set_xlabel(‘Petal Length‘)
ax.set_ylabel(‘Sepal Width‘)
plt.title(‘DBSCAN for Outlier Detection‘)
Text(0.5, 1.0, ‘DBSCAN for Outlier Detection‘)
Python for Data Science - DBSCan clustering to identify outliers
标签:apt order eps ddl ilo tput one targe ram
原文地址:https://www.cnblogs.com/keepmoving1113/p/14320912.html