标签:title position run 点击事件 screen nbsp item col 注意
我们使用OWC Chart生成曲线的时候,可能遇到这种数据表:
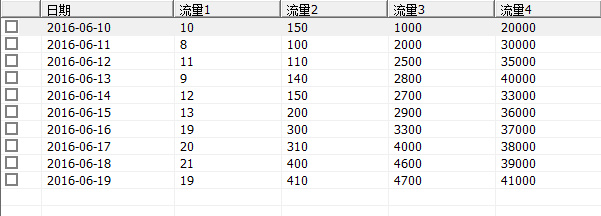
这些数据数量级差距较大,通常的去先做出来是这个样子的:
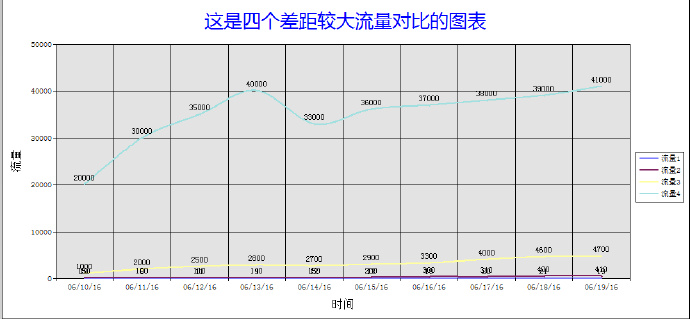
这样对比不好看数据变化,OWC可以使用增加数值轴的方式,让不同的变量绑定不同的数值轴,很好的解决了这个问题。在画面上添加一个按钮,用于生成多数值轴曲线图,按钮的鼠标点击事件vbs代码:
Sub OnClick(ByVal Item)
Dim LV,Chart,cht,c,cst,xValue()
Dim y1Value(),y2Value(),y3Value(),y4Value()
Dim y2Axes,y3Axes,y4Axes,count,i
Dim sc1,sc2,sc3,sc4
Dim dl1,dl2,dl3,dl4
Set Chart=ScreenItems("Chart")
Set LV=ScreenItems("LV")
count=LV.listitems.count
Redim xValue(count),y1Value(count),y2Value(count),y3Value(count),y4Value(count)
Set c=Chart.constants
Chart.Clear ‘先清空
Set cht=Chart.Charts.Add
Chart.HasChartSpaceTitle=True
Set cst=Chart.ChartSpaceTitle
‘定义横纵坐标内容数组
For i=1 To count
xValue(i)= CStr(LV.Listitems.item(i).listsubitems.item(1).text)
y1Value(i)=LV.Listitems.item(i).listsubitems.item(2).text
y2Value(i)=LV.Listitems.item(i).listsubitems.item(3).text
y3Value(i)=LV.Listitems.item(i).listsubitems.item(4).text
y4Value(i)=LV.Listitems.item(i).listsubitems.item(5).text
Next
‘初始化图表内容
With Cht
.type=c.chChartTypeSmoothLineStacked
.HasLegend =True
With .Axes
.Item(0).Scaling.Minimum=1
.Item(0).Scaling.Maximum=count
.Item(0).HasTitle=True
.Item(0).Title.Caption ="时间"
.Item(1).Scaling.Minimum=0
.Item(1).Scaling.Maximum=50
.Item(1).HasTitle=True
.Item(1).Title.Caption ="流量"‘
‘有主网格线
.Item(0).HasMajorGridlines=True
.Item(0).HasTickLabels=True
.Item(0).HasAutoMajorUnit=True
End With
‘流量1
Set sc1=.SeriesCollection.Add
sc1.caption="流量1"
sc1.Ungroup True
‘x轴数据
.SetData c.chDimCategories,c.chDataLiteral,xValue
‘Y轴数据
sc1.SetData c.chDimValues,c.chDataLiteral,y1Value
Set dl1 = sc1.DataLabelsCollection.Add
dl1.HasValue = True
dl1.Font.Size = 9
dl1.Font.Color = vbBlack
‘流量2
Set sc2=.SeriesCollection.Add
sc2.caption= "流量2"
sc2.Ungroup True ‘序列2的坐标轴是独立的
Set y2Axes = .Axes.Add(.SeriesCollection.Item(1).Scalings(c.chDimValues))
y2Axes.Position = c.chAxisPositionRight ‘坐标轴在右边
y2Axes.Scaling.Minimum=0 ‘序列2的坐标轴下限
y2Axes.Scaling.Maximum=500 ‘序列2的坐标轴上限
‘Y轴数据
sc2.SetData c.chDimValues,c.chDataLiteral,y2Value
Set dl2 = sc2.DataLabelsCollection.Add
dl2.HasValue = True
dl2.Font.Size = 9
dl2.Font.Color = vbBlack
‘流量3
Set sc3=.SeriesCollection.Add
sc3.caption="流量3"
sc3.Ungroup True ‘序列3的坐标轴是独立的
Set y3Axes = .Axes.Add(.SeriesCollection.Item(2).Scalings(c.chDimValues))
y3Axes.Position = c.chAxisPositionRight ‘坐标轴在右边
y3Axes.Scaling.Minimum=0 ‘序列3的坐标轴下限
y3Axes.Scaling.Maximum=5000 ‘序列3的坐标轴上限
‘Y轴数据
sc3.SetData c.chDimValues,c.chDataLiteral,y3Value
Set dl3 = sc3.DataLabelsCollection.Add
dl3.HasValue = True
dl3.Font.Size = 9
dl3.Font.Color = vbBlack
‘流量4
Set sc4=.SeriesCollection.Add
sc4.caption="流量4" ‘序列4的坐标轴是独立的
sc4.Ungroup True
Set y4Axes = .Axes.Add(.SeriesCollection.Item(3).Scalings(c.chDimValues))
y4Axes.Position = c.chAxisPositionRight ‘坐标轴在右边
y4Axes.Scaling.Minimum=0 ‘序列4的坐标轴下限
y4Axes.Scaling.Maximum=50000 ‘序列4的坐标轴上限
‘Y轴数据
sc4.SetData c.chDimValues,c.chDataLiteral,y4Value
Set dl4 = .SeriesCollection.item(3).DataLabelsCollection.Add
dl4.HasValue = True
dl4.Font.Size = 9
dl4.Font.Color = vbBlack
End With
With cst
.Caption="这是四个差距较大流量对比的图表"
.Font.Color =vbBlue
.Font.Name="微软雅黑"
.Font.size=20
End With
End Sub
保存后运行,现在出来的曲线是这个样子,是不是好了很多?
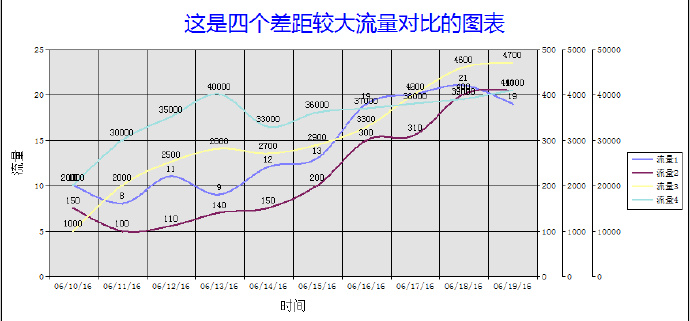
要注意chart控件需要是V11.0,如果是V9.0那么多坐标轴不会有效果,此外V11.0的横坐标序号为.item(0),纵坐标为.item(1),而V9.0的横坐标标序号为.item(1),纵坐标为.item(0),在定义坐标轴中文标识以及范围时需要注意。
搬家第11天-149.Wincc V7.3 OWC Chart控件初步使用11-差距大变量曲线处理
标签:title position run 点击事件 screen nbsp item col 注意
原文地址:https://www.cnblogs.com/fishingsriver/p/14390883.html