标签:set pes pack vat targe 计数器 ons 正式 clr
Prometheus 是一个开源的现代化,云原生的系统监控框架,并且可以轻松的集成 PushGateway, AlertManager等组件来丰富它的功能。
对于 k8s 下部署的系统来说使用 Prometheus 来做系统监控会是一个比较不错的选择,我们现在正在使用的模式就是应用暴露 metrics 信息给 Prometheus,然后使用 Grafana 做展示。
Prometheus 是一套开源的系统监控和报警框架,灵感源自 Google 的 Borgmon 监控系统。
2012年,SoundCloud的 Google 前员工创造了 Prometheus,并作为社区开源项目进行开发。2015年,该项目正式发布。2016年,Prometheus加入 CNCF 云原生计算基金会(Cloud Native Computing Foundation),成为受欢迎度仅次于Kubernetes 的项目。
Prometheus 具有以下特性:
多维的数据模型(基于时间序列的Key、Value键值对)
灵活的查询和聚合语言 PromQL
提供本地存储和分布式存储
通过基于 HTTP 的 Pull 模型采集时间序列数据
可利用 Pushgateway(Prometheus的可选中间件)实现 Push 模式
可通过动态服务发现或静态配置发现目标机器
支持多种图表和数据大盘
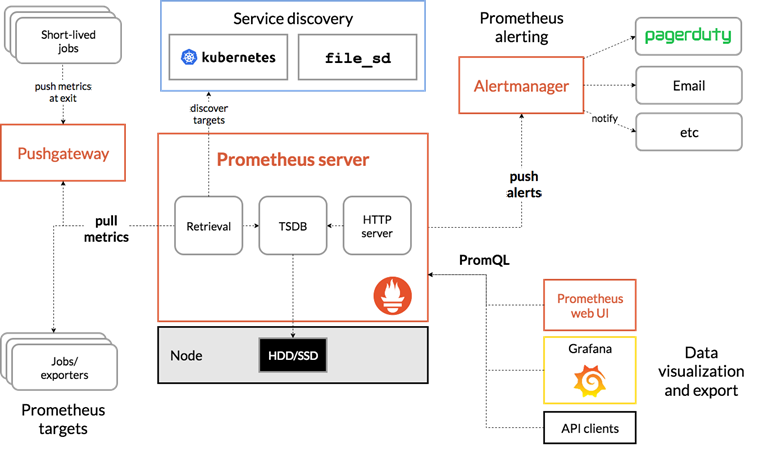
Prometheus 架构图:
Prometheus 支持 4 种 Metrics 类型,分别是 Counter、Gauge、Histogram、Summary
具体可以参考官方文档的介绍:https://prometheus.io/docs/concepts/metric_types
metrics_name{
举个例子:
dotnet_collection_count_total{generation="1"} 3
metrics_name 是 dotnet_collection_count_total,metrics 的值是 3,这个 metrics 有一个 label, 名称是 generation,值是 1
在 dotnet 中可以使用 prometheus-dotnet/AppMetrics/Prometheus.Client 等来实现和 Prometheus 的集成,目前比较活跃的,用的比较多的是 prometheus-dotnet 这个库,很多 prometheus 的扩展都是基于这个库的,prometheus 默认已经集成了很多 metrics ,所以可以通过一些简单的配置就可以获取到很多有用的 metrcis 信息,后面对于支持的 metrics 做了一个汇总
安装 nuget 包
dotnet add package prometheus-net.AspNetCore
注册 endpoint 路由,新版本的 prometheus-net.AspNetCore 使用 endpoint 路由的方式来注册 Prometheus 的 metrics
app.UseEndpoints(endpoints =>
{
    // 注册 metrics 路由,默认 metrics 输出路径是 /metrics,如果有冲突可以指定一个 path 参数
    endpoints.MapMetrics();

    endpoints.MapControllers();
});
如果不需要统计 HttpRequest 的信息,这样就已经足够了,如果要统计 HttpRequest 的处理信息,需要在 UseRounting 之后注册 UseHttpMetrics 中间件
HttpMetrics 默认会增加三种 metrics,一个是处理的请求数量,一个是正在处理的请求数量,还有一个是请求处理耗时的一个统计,如果要禁用某一种 metrics,可以传入一个 Options 或者通过委托配置 Enabled
app.UseHttpMetrics(options=>
{
    options.RequestCount.Enabled = false;
});
配置好之后可以在 /metrics 路径上看到类似下图的 metrics 输出就证明正常工作了
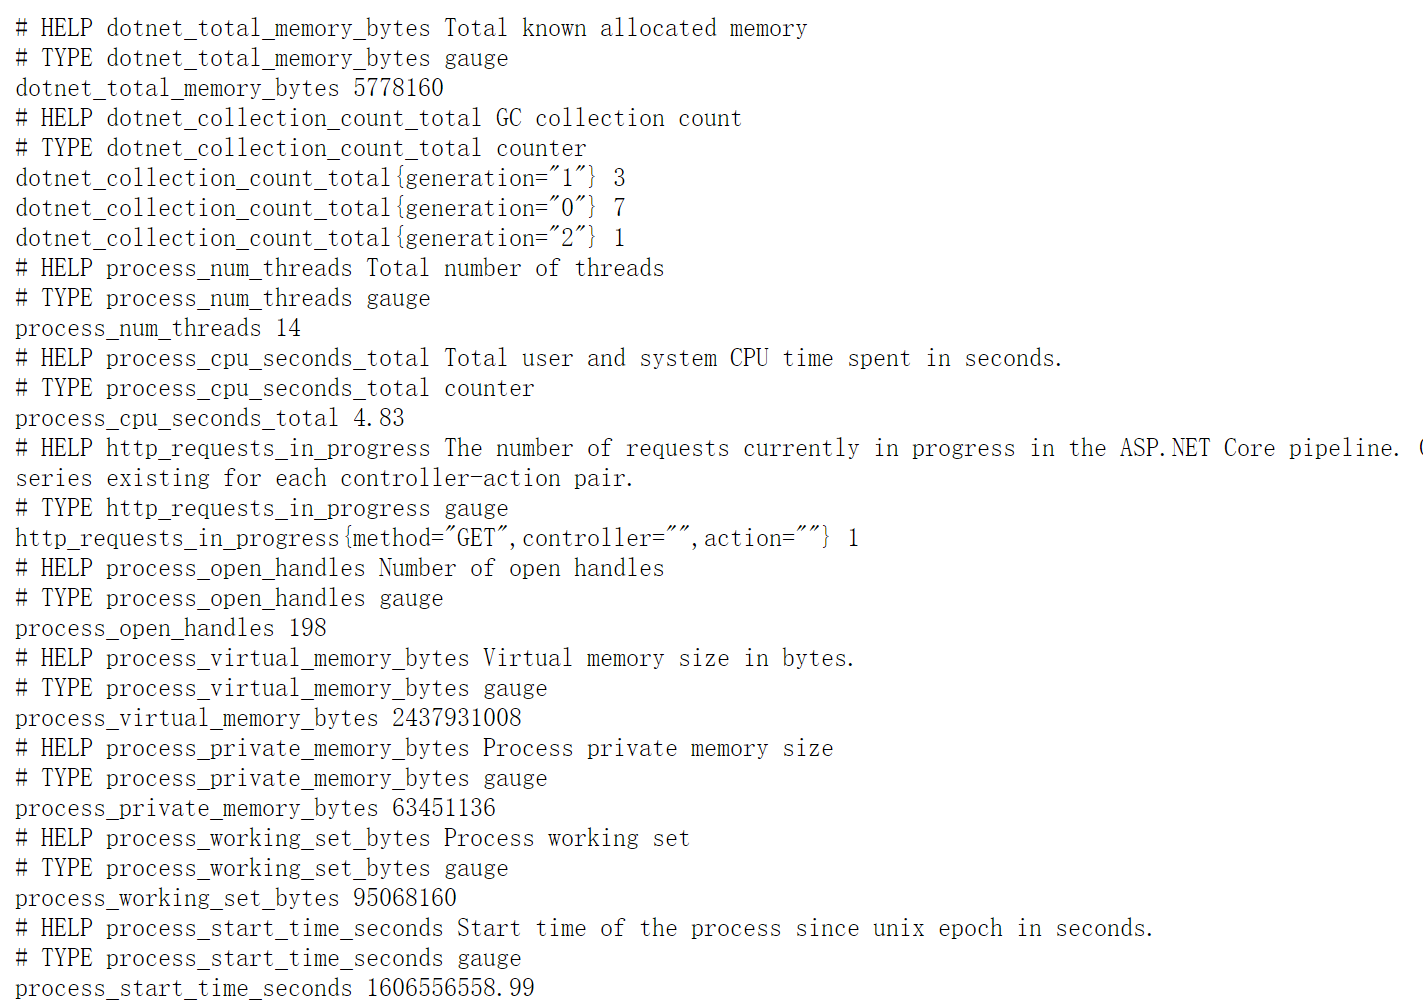
输出 metrics 的格式如下:
# HELP dotnet_total_memory_bytes Total known allocated memory
# TYPE dotnet_total_memory_bytes gauge
dotnet_total_memory_bytes 6184632
第一行表示这个 metrics 对应的 description,大概介绍
第二行表示这个 metrics 对应的类型
第三行后面的表示 metrics 的数据
| metrics mame | Description | Get Method | Metric Type |
|---|---|---|---|
| dotnet_collection_count_total | 每一代 GC 垃圾回收的次数,可以通过 label 区分 | GC.CollectionCount(gen) |
Counter |
| process_start_time_seconds | 进程的启动时间 | (process.StartTime.ToUniversalTime() - epoch).TotalSeconds |
Gauge |
| process_cpu_seconds_total | 进程使用的 CPU 时间 | process.TotalProcessorTime.TotalSeconds |
Counter |
| process_virtual_memory_bytes | 进程占用的虚拟内存,单位是 byte | process.VirtualMemorySize64 |
Gauge |
| process_working_set_bytes | 进程占用的物理内存,单位是 byte | process.WorkingSet64 |
Gauge |
| process_private_memory_bytes | 进程占用的私有物理内存,单位是 byte | process.PrivateMemorySize64 |
Gauge |
| process_open_handles | 进程打开的句柄数 | process.HandleCount |
Gauge |
| process_num_threads | 进程内线程数量(操作系统线程数量) | process.Threads.Count |
Gauge |
| dotnet_total_memory_bytes | GC 已分配的内存,单位是 byte | GC.GetTotalMemory(false) |
Gauge |
| Name | Description | Type |
|---|---|---|
| http_requests_in_progress | 正在处理的 HTTP 请求 | Gauge |
| http_requests_received_total | 应用启动后处理的 HTTP 请求总数 | Counter |
| http_request_duration_seconds | HTTP 请求处理时间 | Histogram |
在前面我们已经在应用中输出了 metrics,下一步就是把 Metrics 集成到 prometheus 里去
首先我们需要安装 Prometheus,从官网下载 Prometheus,下载之后解压到一个目录下面,修改配置文件添加一个 job 来抓取应用中的 metrics 信息:
打开 prometheus.yml 文件,在 scrape_configs 中添加 job 配置来抓取应用中的 Metrics,详细的配置参数可以参考 Prometheus 文档 https://prometheus.io/docs/prometheus/latest/configuration/configuration/
scrape_configs:
  - job_name: ‘aspnetcore‘
    static_configs:
    - targets: [‘localhost:65026‘]
配置好之后启动 prometheus,之后可以在 http://localhost:9090 打开 ui 界面
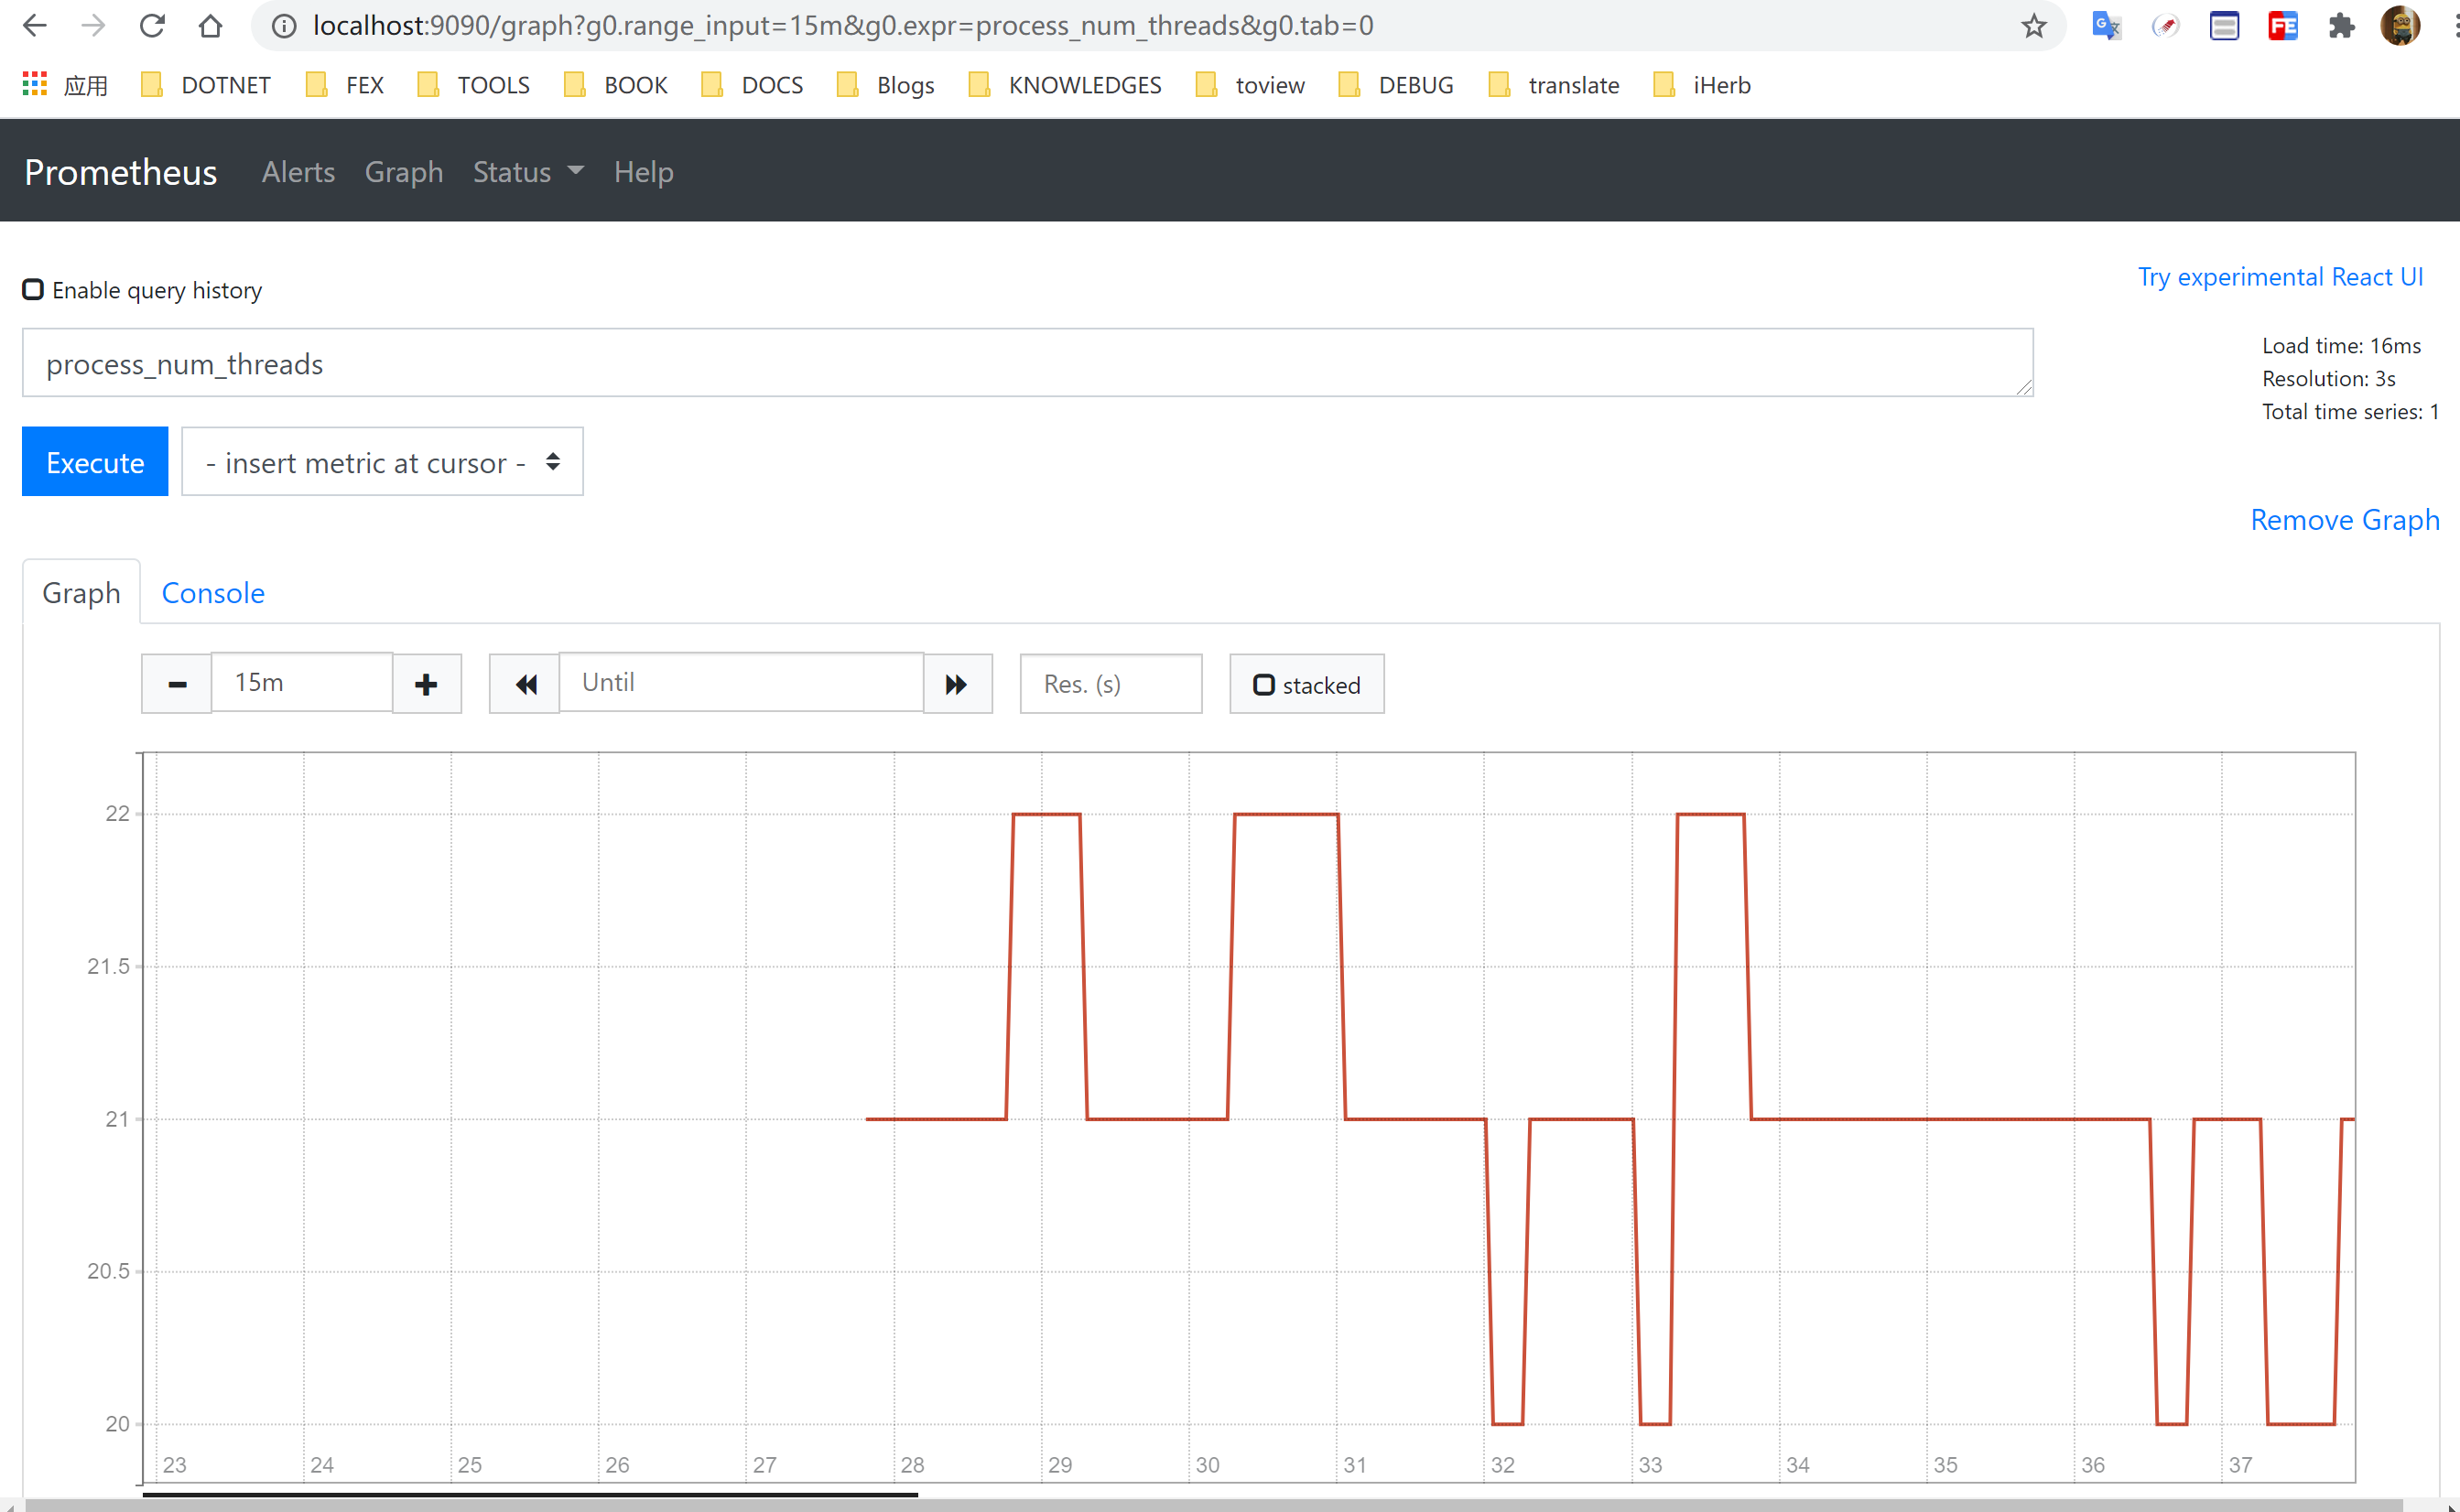
查询 process_num_threads metrcis 信息,可以看到数据已经同步到了 prometheus,我们也可以进一步在 Grafana 中做可视化的 metrics 展示,如果有需要也可以再集成 AlertManager 来做报警
prometheus-dotnet 除了上面的 metrics 之外还有很多扩展,有一个能够很丰富的 CLR 指标的扩展库 https://github.com/djluck/prometheus-net.DotNetRuntime
这个是目前是基于 CLR 暴露的 EventSource 来实现的,实现的指标有很多,比如说 GC,线程池,JIT等一系列信息,后面作者还有计划在新版本中实现基于 EventCounters 来实现一些指标,内容比较多下次再写一篇文章来介绍。
标签:set pes pack vat targe 计数器 ons 正式 clr
原文地址:https://www.cnblogs.com/treeskyer/p/14526183.html