My company got a new customer for our product and around 2-3 months ago all setup was formed for that project including necessary hardwares and softwares. Application experts even managed to install 2 libraries (sub-modules). Everything was going smoothly (at least everyone was thinking the same but remember professional/hardcore DBAs were not involved in that project till then) but last week, while installing next 4 libraries, application process was getting error out with Timeout error. After doing analysis, our RnD group suggested that application is not getting faster response from database and that’s why application is not able to install any of the new library out of 4. Before this issue come to DBA Team, other people having some DB related knowledge tried to check it.
So rather than we start looking at what was actual resolution of this issue, let’s first look into analysis other people did:
1. Taking AWR report of 24 hours: Well, what can I say about it other than start counting numbers from 100 to 0, just to control myself Why was it a wrong strategy? Simple, AWR report gives you overall picture of DB (i.e. consolidated picture of all DB sessions) but here only application installation type sessions were having problem meaning only particular module was facing slowness. Choosing ASH was expected and not AWR.
Other thing which I don’t like is to take AWR report for big time duration. 24 hours would have been OK if DB was having issues lasting for 24 hours!!!! Please take AWR reports only for problematic time duration and not for 24 hours. In case any particular DB job is making database slow then take manual snapshots before and after that job.
2. Wrong interpretation of ADDM findings: By seeing “Commits and Rollbacks” in ADDM + timeout error in application logs, people thought that it’s due to connection break. Connection break is causing application transactions to rollback. But unfortunately I didn’t understand how they relate it to “Log File Sync”. Worst thing was they did DB restart “thinking” it will help in performance issue
3. Resizing redo log buffer: By reading general recommendations from random blogs, people resized redo log buffer and SGA in the hope of resolution.
Let’s see how I started analysis of this issue. As I already told, I decided to use ASH strategy as sessions coming from only 1 module were having issues. I always use Tanel Poder‘s troubleshooting scripts while doing analysis. You can download those from here or my version of those scripts from here. First I used script dashtop.sql (ashtop’s historical version) to find out wait events for sessions coming from our slow module.
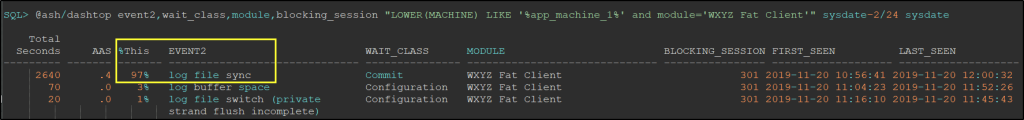 Please note that 97% of the total waiting time was spent on log file sync event. So from this I come to know that out application was suffering from log file sync. What about that blocking_session? What was that?
 Upon querying v$session for session with SID 300, I come to know that it was LGWR.
At this point I understood that log file sync is giving us trouble. As it’s log file sync, it’s most likely that my other DB sessions should also be suffering at some extend. So I decided to take AWR report with smallest duration possible and there was 1 more reason behind taking AWR report. I want to find average wait time DB was spending on log file sync. (Please note that in this post I’m not explaining why I choose this section only of AWR report and other WH questions related to AWR report. Let’s keep it pending for some other day as a topic for new post )
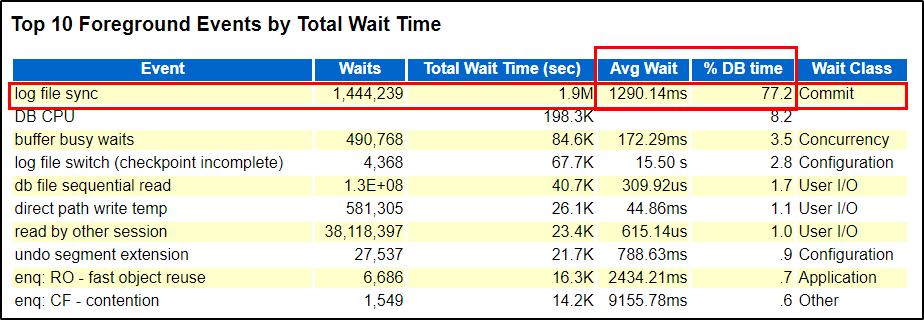 OMG!!!!! log file sync is consuming ~77% of total DB time with average wait time of 1290 milliseconds. This was my first time when I saw Log File Sync with this much high avg wait. In general it should be less than 5 ms as per experts like Craig Shallahamer and I follow his guide lines.
So far we come to know that log file sync is the dominant wait event with average wait time 1290ms but it’s an average. Can we go deeper into it to understand it more nicely? Indeed yes and we can even plot some graphs to make it more “manager” friendly. I used scripts swEhAwrGet.sql and swEhCharts.r of Craig which take AWR snapshots rang as input along with wait event name and put nice graphs with R language. That swEhAwrGet.sql uses wait event histogram stats to get numbers from AWR repository (dba_hist_event_histogram view).
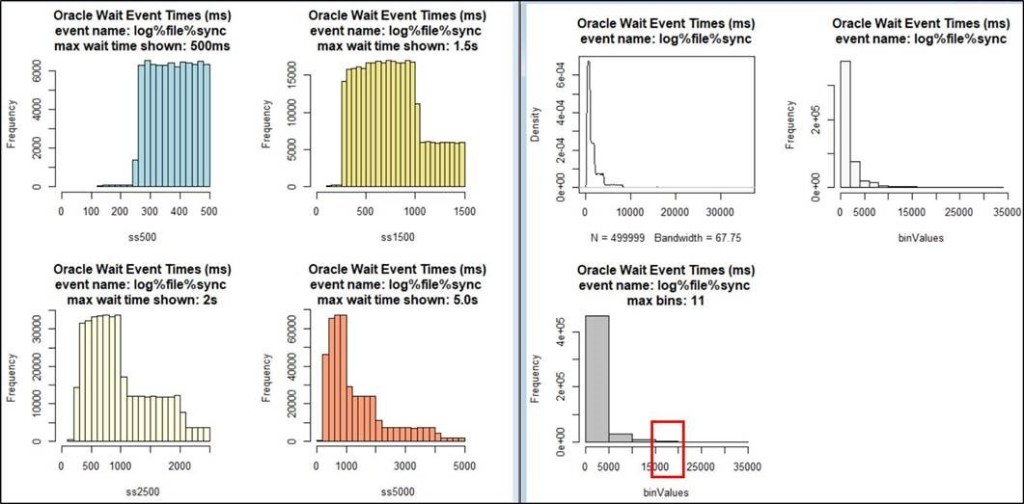 If you can please observe graph immediate left to blue one, we can see that most of the samples of Log File Sync are falling under time range 250ms to 1000ms with slowest response we got was around 20000ms. This is crazy when we compare it with our 5ms threshold.
Then I decided to view ADDM recommendations to solidify my findings. ADDM was recommending to use faster disks for Redo log files.
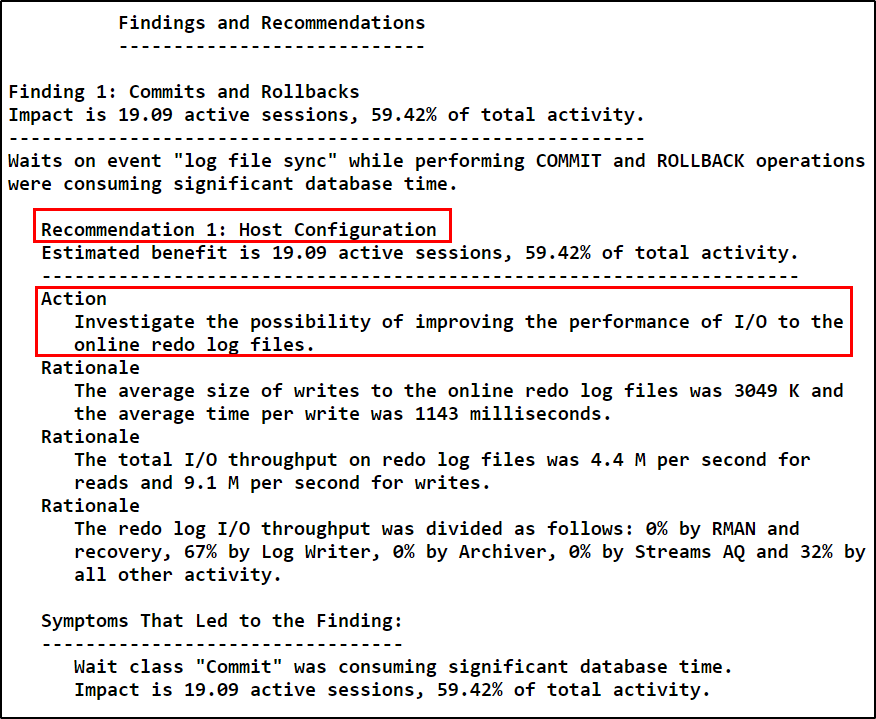 Please note that I’m using Findings and Recommendations section of ADDM and not Top ADDM Findings by Average Active Sessions which was the mistake my colleague did.
Well, I did my analysis and I shared it with application experts but as always IO admin didn’t find anything wrong in it. He was also right at some extend, as for these SSD devices he observed no latency with write. May be it was redo files and SSD combination or drives were actually faultyor something else but bottom-line was they didn’t accept my findings. So I raised a SR with Oracle. Oracle confirmed my findings and we finally asked our customer to talk with IO vendor.
Well, happy ending? nope. This story has 2 big twists.
When I shared my findings over mail, our expert senior DBA was there in that mail chain and he asked me: How many redo logs members each group is having? My answer was 2. He suggested to take a calculative risk and bring down log member number to 1 rather than waiting for IO vendor to reply us back. Indeed it was a smart suggestion but with some risk which I took and guess what, application installation got complete!!!! I agree that it was not as fast it should have been but at least we were able to finish it and were able to save my company’s reputation.
Great, story ended? Nahhhh, one final twist in the tale.
We completed application installation on Friday but on Saturday morning, I received a call with news that DB went down and it’s not coming up. Alert.log was having messages ORA-01115: IO error reading block from file NN and messages file from OS confirmed that one of the IO disk got crashed due to errors. So at the end we had to request IO vendor to replace the disk and we are yet to recover that DB. Which may take some more time.
So few final thoughts before I end this post:
1. Please use ASH for session level analysis. Beware that AWR and ASH usage needs special Oracle license.
2. Do not confuse with ADDM recommendations rather use them as a guideline for your analysis.
3. Whenever there’s slowness with Log file Sync, please don’t rush with memory resizing. Try to analyze the situation first.
4. In general Log File Sync should have avg wait less than 5ms for mission critical transactional processing databases. Do not forget to use wait event histogram to get more detailed information about it.
5. If there problem with write speed of IO devices there’s hardly anything you can do as a DBA like in my case we decided to reduce redo log groups redundancy to 1. Better to go to IO admin.
6. I could have even used log file trace file to get more information about it and also lfsdiag.sql provided by Oracle MOS link.
I hope you have found this post informative. Please do not hesitate to comment your thoughts and suggestions. Hopefully I will find myself trapped in new performance related issue soon, till then take care