标签:style blog http io color ar os 使用 sp
php报表的使用:
1、到官网(http://jpgraph.net/)下载,建议下载jpgraph-3.0.7.tar.gz版本
2、解压后有两个文件夹
docportal:使用手册
src:报表核心文件
3、配置核心文件(对于src文件夹内容的操作)
1)创建一个jpgraph文件夹
2)将和Examples同级目录下的其它内容放在jpgraph文件夹下
3)将jpgraph放在Examples里
4)查找效果图。Examples里的每个php文件对应一个报表,可以在jpgraph11-3.0.7\docportal\chunkhtml\images查看报表的效果图,效果图的文件名和对应php文件的文件名相同
(如果你打开Examples文件夹里的某一个文件,你会发现有这样一句代码:require_once (‘jpgraph/jpgraph.php‘)。但你却在该文件夹里没有找到jpgraph文件夹。其实jpgraph文件夹里的内容都放在和Examples同一目录下。因此你只要在Examples里创建一个jpgraph文件夹,并把和Examples同级目录的其它内容放到该文件夹里即可。)
4、案例分析
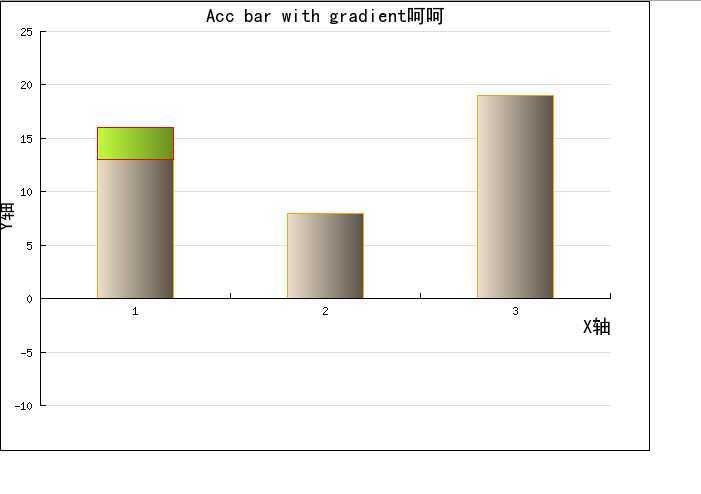
1)柱形图1
代码:

 1 <?php // content="text/plain; charset=utf-8"
 2 require_once (‘jpgraph/jpgraph.php‘);
 3 require_once (‘jpgraph/jpgraph_bar.php‘);
 4
 5
 6 $datay1=array(13,8,19);
 7 $datay2=array(3,0,0);//多增加的数据
 8
 9 // Create the graph.
10 $graph = new Graph(650,450);//画布大小
11 //$graph->SetScale(‘textlin‘);
12 $graph->SetScale(‘textlin‘,-10,25);//设置y轴范围为5-75
13 $graph->yaxis->scale->ticks->Set(5);//设置y轴刻度为10
14 //$graph->xaxis->scale->ticks->Set(5);
15 $graph->xaxis->title->Set("X轴");
16 $graph->xaxis->title->SetFont(FF_SIMSUN,FS_BOLD,14);
17 $graph->yaxis->title->Set("Y轴");
18 $graph->yaxis->title->SetFont(FF_SIMSUN,FS_BOLD,14);
19
20 $graph->SetMarginColor(‘white‘);//设置边框背景颜色
21 $graph->SetMargin(40,40,10,10);//设置图在边框中的位置
22
23 // Setup title
24 $graph->title->Set(‘Acc bar with gradient呵呵‘);//设置标题,默认的标题不支持中文
25 $graph->title->SetFont(FF_SIMSUN,FS_BOLD,14);   //设置字体类型和大小。第一个参数决定是否能显示中文。参数值可参考jpgraph_ttf.inc.php文件
26
27 // Create the first bar
28 $bplot = new BarPlot($datay1);
29 $bplot->SetFillGradient(‘AntiqueWhite2‘,‘AntiqueWhite4:0.8‘,GRAD_VERT);//设置柱体颜色
30 //$bplot->SetFillgradient(‘orange‘,‘darkred‘,GRAD_VER); //设置柱体颜色
31 $bplot->SetColor(‘orange‘);//柱体边界的颜色
32
33 // Create the second bar
34 $bplot2 = new BarPlot($datay2);
35 $bplot2->SetFillGradient(‘olivedrab1‘,‘olivedrab4‘,GRAD_VERT);//柱体中增加部分的颜色
36 $bplot2->SetColor(‘red‘);//柱体中增加部分的边框颜色
37
38
39 // And join them in an accumulated bar
40 $accbplot = new AccBarPlot(array($bplot,$bplot2));
41 $graph->Add($accbplot);
42
43 $graph->Stroke();
44 ?>
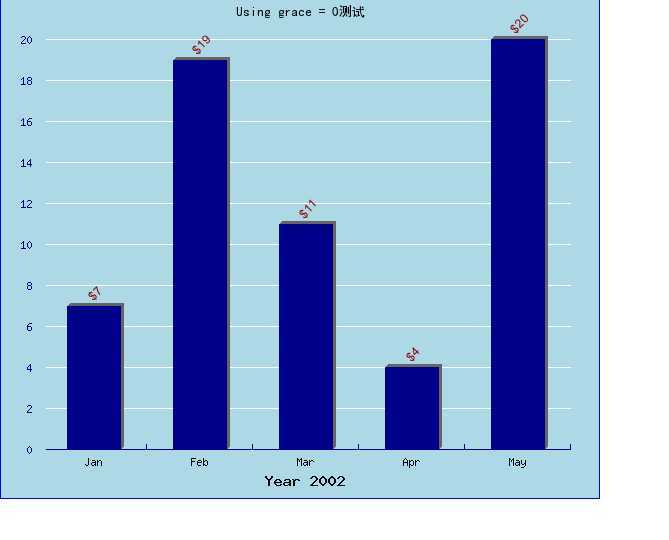
2)柱形图2
代码:
 1 <?php // content="text/plain; charset=utf-8"
 2 require_once (‘jpgraph/jpgraph.php‘);
 3 require_once (‘jpgraph/jpgraph_bar.php‘);
 4
 5 // Some data
 6 $datay=array(7,19,11,4,20);
 7
 8 // Create the graph and setup the basic parameters
 9 $graph = new Graph(600,500,‘auto‘);
10 $graph->img->SetMargin(40,30,40,50);
11 $graph->SetScale("textint");
12 $graph->SetFrame(true,‘blue‘,1); //边框边界的颜色
13 $graph->SetColor(‘lightblue‘);//柱体图背景颜色
14 $graph->SetMarginColor(‘lightblue‘);//边框背景颜色
15
16 // Setup X-axis labels
17 $a = $gDateLocale->GetShortMonth();//x轴用月份显示
18 $graph->xaxis->SetTickLabels($a);
19 $graph->xaxis->SetFont(FF_FONT1);
20 $graph->xaxis->SetColor(‘darkblue‘,‘black‘);//x轴的颜色
21
22 // Setup "hidden" y-axis by given it the same color
23 // as the background (this could also be done by setting the weight
24 // to zero)
25 $graph->yaxis->SetColor(‘lightblue‘,‘darkblue‘);//y轴颜色
26 $graph->ygrid->SetColor(‘white‘);//y轴分割线的颜色
27
28 // Setup graph title ands fonts
29 $graph->title->Set(‘Using grace = 0测试‘);
30 $graph->title->SetFont(FF_SIMSUN,FS_BOLD);//FF_SIMSUN显示中文
31 $graph->xaxis->SetTitle(‘Year 2002‘,‘center‘);
32 $graph->xaxis->SetTitleMargin(10);//x轴标题显示的位置
33 $graph->xaxis->title->SetFont(FF_FONT2,FS_BOLD);
34
35 // Add some grace to the top so that the scale doesn‘t
36 // end exactly at the max value.
37 $graph->yaxis->scale->SetGrace(0);//修改y轴显示的最大的值
38
39
40 // Create a bar pot
41 $bplot = new BarPlot($datay);
42 $bplot->SetFillColor(‘darkblue‘);//柱体填充的颜色
43 $bplot->SetColor(‘darkblue‘);//柱体边框颜色
44 $bplot->SetWidth(0.5);//设置柱体的宽度,取值:0~1
45 $bplot->SetShadow(‘darkgray‘);//柱体阴影颜色
46
47
48 /*显示和设置柱体上数字的样式*/
49 $bplot->value->Show();
50 $bplot->value->SetFont(FF_ARIAL,FS_NORMAL,9);//柱体上数字的字体和大小
51 $bplot->value->SetFormat(‘$%d‘);//柱体上数字的格式
52 $bplot->value->SetColor(‘darkred‘);//柱体上数字的颜色
53 $bplot->value->SetAngle(45);//柱体上数字的倾斜度
54 $graph->Add($bplot);
55
56 // Finally stroke the graph
57 $graph->Stroke();
58 ?>
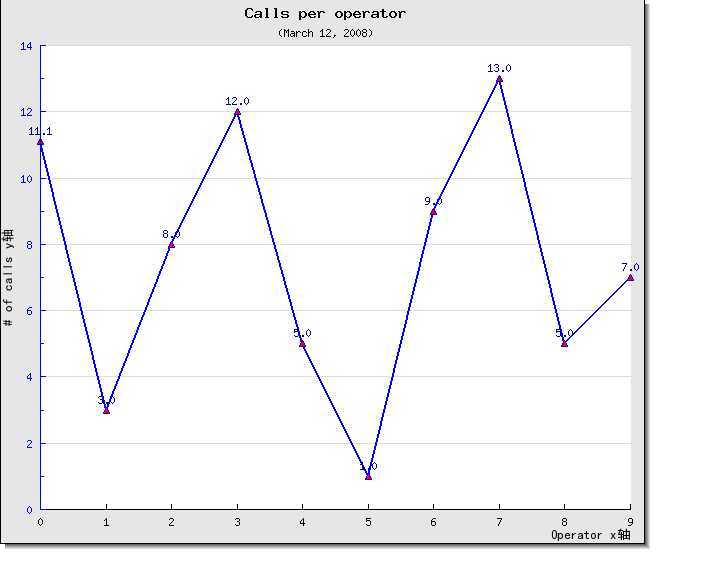
3)折线图
代码:
<?php // content="text/plain; charset=utf-8"
require_once (‘jpgraph/jpgraph.php‘);
require_once (‘jpgraph/jpgraph_line.php‘);

// Some (random) data
$ydata = array(11.1,3,8,12,5,1,9,13,5,7);

// Size of the overall graph
$width=650;
$height=550;

// Create the graph and set a scale.
// These two calls are always required
$graph = new Graph($width,$height);
$graph->SetScale(‘intlin‘);
$graph->SetShadow();

// Setup margin and titles
$graph->SetMargin(40,20,20,40);
$graph->title->Set(‘Calls per operator‘);//标题
$graph->subtitle->Set(‘(March 12, 2008)‘);//副标题
$graph->xaxis->title->Set(‘Operator x轴‘);
$graph->yaxis->title->Set(‘# of calls y轴‘);

$graph->yaxis->title->SetFont( FF_SIMSUN , FS_BOLD );
$graph->xaxis->title->SetFont( FF_SIMSUN , FS_BOLD );

$graph->yaxis->SetColor(‘blue‘);

// 折线
$lineplot=new LinePlot($ydata);
$lineplot->SetColor( ‘blue‘ );
$lineplot->SetWeight( 2 );   // 折线图颜色
$lineplot->mark->SetType(MARK_UTRIANGLE);

/*折线处的标记*/
$lineplot->mark->SetColor(‘blue‘);
$lineplot->mark->SetFillColor(‘red‘);

$lineplot->value->Show();//在折线处显示数据

// Add the plot to the graph
$graph->Add($lineplot);

// Display the graph
$graph->Stroke();
?>
标签:style blog http io color ar os 使用 sp
原文地址:http://www.cnblogs.com/yingww/p/4098210.html
