码迷,mamicode.com
首页 > Web开发 > 详细

ZP的EXTJS学习笔记(四)——图表的简单使用(图表点击事件)

时间:2014-11-19 13:52:15      阅读:285      评论:0      收藏:0      [点我收藏+]

标签:style   blog   http   io   ar   color   os   使用   sp   

bubuko.com,布布扣

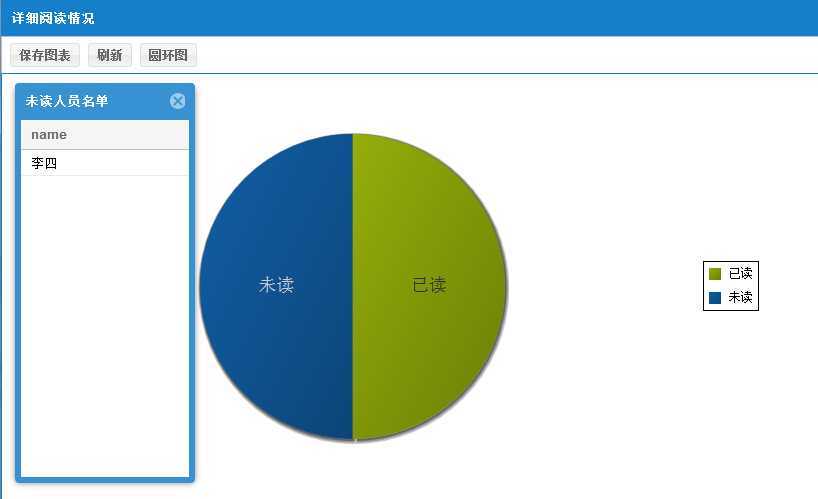
这次做的比较简单,是一个消息阅读情况的展示。

是模仿Example中chart的pie.js做的。

贴下改造后的pie.js:

Ext.require(‘Ext.chart.*‘);
Ext.require([‘Ext.layout.container.Fit‘, ‘Ext.window.MessageBox‘]);

Ext.onReady(function () {
    //store1.loadData(generateData(6, 20));

    var donut = false,
        chart = Ext.create(‘Ext.chart.Chart‘, {
            xtype: ‘chart‘,
            animate: true,
            id: ‘domid‘,
            store: store1,
            shadow: true,
            legend: {
                position: ‘right‘
            },
            insetPadding: 60,
            theme: ‘Base:gradients‘,
            /*listeners: {
                click: {
                    element: Ext.get(‘domid‘), //bind to the underlying el property on the panel
                    fn: function(o) {
                        //alert(o.index);
                        var items = chart.series.get(0).items, i;
                        alert(items[1].storeItem.get(‘name‘));
                    }
                }
            },*/
            series: [{
                type: ‘pie‘,
                field: ‘data1‘,
                showInLegend: true,
                donut: donut,
                listeners : {  
                    itemclick : function(o) { 
                        if(o.index == 1){
                            var noReadStore  = Ext.create(‘Ext.data.Store‘, {
                                fields: [‘id‘, ‘name‘],
                                proxy: {
                                    type: ‘ajax‘,
                                    api: {
                                        read: ‘../mail/getNoReadMember.dhtml‘
                                    },
                                    reader: {
                                           type: ‘json‘,
                                        root: ‘members‘
                                    }
                                }
                            });
                            noReadStore.load();
                            var noReadGrid =  Ext.create(‘Ext.grid.Panel‘, {  
                                border: false,  
                                store: noReadStore,  
                                columns: [{//实现图标
                                            header : ‘name‘,
                                            dataIndex : ‘name‘,
                                            flex: 1
                                }],
                                emptyText: ‘无未读人员。‘  
                            });  
                            Ext.create(‘Ext.Window‘, {
                                title: ‘未读人员名单‘,
                                    width: 180,
                                height: 400,
                                x: 100,
                                y: 80,
                                plain: true,
                                headerPosition: ‘top‘,
                                layout: ‘fit‘,
                                items: noReadGrid
                            }).show();
                        }else if(o.index == 0){
                            var readStore  = Ext.create(‘Ext.data.Store‘, {
                                fields: [‘id‘, ‘name‘],
                                proxy: {
                                    type: ‘ajax‘,
                                    api: {
                                        read: ‘../mail/getReadMember.dhtml‘
                                    },
                                    reader: {
                                           type: ‘json‘,
                                        root: ‘members‘
                                    }
                                }
                            });
                            readStore.load();
                            var readGrid =  Ext.create(‘Ext.grid.Panel‘, {  
                                border: false,  
                                store: readStore,  
                                columns: [{//实现图标
                                            header : ‘name‘,
                                            dataIndex : ‘name‘,
                                            flex: 1
                                }],
                                emptyText: ‘无已读人员。‘  
                            });  
                            Ext.create(‘Ext.Window‘, {
                                title: ‘已读人员名单‘,
                                    width: 180,
                                height: 400,
                                x: 430,
                                y: 80,
                                plain: true,
                                headerPosition: ‘top‘,
                                layout: ‘fit‘,
                                items: readGrid
                            }).show();
                        }
                    }  
                },
                tips: {
                  trackMouse: true,
                  width: 140,
                  height: 28,
                  renderer: function(storeItem, item) {
                    //calculate percentage.
                    var total = 0;
                    store1.each(function(rec) {
                        total += rec.get(‘data1‘);
                    });
                    this.setTitle(storeItem.get(‘name‘) + ‘: ‘ + Math.round(storeItem.get(‘data1‘) / total * 100) + ‘%‘);
                  }
                },
                highlight: {
                  segment: {
                    margin: 20
                  }
                },
                label: {
                    field: ‘name‘,
                    display: ‘rotate‘,
                    contrast: true,
                    font: ‘18px Arial‘
                }
            }]
        });


    var panel1 = Ext.create(‘widget.panel‘, {
        autoWidth: true,
        height: 500,
        title: ‘详细阅读情况‘,
        renderTo: Ext.getBody(),
        layout: ‘fit‘,
        tbar: [{
            text: ‘保存图表‘,
            handler: function() {
                Ext.MessageBox.confirm(‘确定下载‘, ‘您想将该图表保存为图片么?‘, function(choice){
                    if(choice == ‘yes‘){
                        chart.save({
                            type: ‘image/png‘
                        });
                    }
                });
            }
        }, {
            text: ‘刷新‘,
            handler: function() {
                // Add a short delay to prevent fast sequential clicks
                window.loadTask.delay(100, function() {
                    store1.reload();
                });
            }
        }, {
            enableToggle: true,
            pressed: false,
            text: ‘圆环图‘,
            toggleHandler: function(btn, pressed) {
                chart.series.first().donut = pressed ? 35 : false;
                chart.refresh();
            }
        }],
        items: chart
    });
});

使用基本如上,说下点击图表元素事件的使用。

开始写在chart中,找不到点击区域的表示,之后添加在series中,通过返回参数o.index即可获得点击区域的标签位置,这对于只有两块的图表很好用,如果多了,应该是按右边的索引顺序来的吧。我没试,仅是猜测。

事件部分:

series: [{
                type: ‘pie‘,
                field: ‘data1‘,
                showInLegend: true,
                donut: donut,
                listeners : {  
                    itemclick : function(o) { 
                        alert(o.index);
                    }
                }
            }]

之后我按照index交后台处理数据发送前台生成window显示。


ZP的EXTJS学习笔记(四)——图表的简单使用(图表点击事件)

标签:style   blog   http   io   ar   color   os   使用   sp   

原文地址:http://www.cnblogs.com/peachzhan/p/4107988.html

(0)
(0)
   
举报
评论 一句话评论(0
登录后才能评论!
© 2014 mamicode.com 版权所有  联系我们:gaon5@hotmail.com
迷上了代码!