
___________________________________________________________________

The information contained in this document is provided for informational purposes only and represents the current view of Intel Corporation ("Intel") and its contributors ("Contributors") on, as of the date of publication. Intel and the Contributors make no commitment to update the information contained in this document, and Intel reserves the right to make changes at any time, without notice.
DISCLAIMER. THIS DOCUMENT, IS PROVIDED "AS IS." NEITHER INTEL, NOR THE
CONTRIBUTORS MAKE ANY REPRESENTATIONS OF ANY KIND WITH RESPECT TO PRODUCTS
REFERENCED HEREIN, WHETHER SUCH PRODUCTS ARE THOSE OF INTEL, THE CONTRIBUTORS,
OR THIRD PARTIES. INTEL, AND ITS CONTRIBUTORS EXPRESSLY DISCLAIM ANY AND ALL
WARRANTIES, IMPLIED OR EXPRESS, INCLUDING WITHOUT LIMITATION, ANY WARRANTIES OF
MERCHANTABILITY, FITNESS FOR ANY PARTICULAR PURPOSE, NON-INFRINGEMENT, AND ANY
WARRANTY ARISING OUT OF THE INFORMATION CONTAINED HEREIN, INCLUDING WITHOUT
LIMITATION, ANY PRODUCTS, SPECIFICATIONS, OR OTHER MATERIALS REFERENCED HEREIN.
INTEL, AND ITS CONTRIBUTORS DO NOT WARRANT THAT THIS DOCUMENT IS FREE FROM
ERRORS, OR THAT ANY PRODUCTS OR OTHER TECHNOLOGY DEVELOPED IN CONFORMANCE WITH
THIS DOCUMENT WILL PERFORM IN THE INTENDED MANNER, OR WILL BE FREE FROM
INFRINGEMENT OF THIRD PARTY PROPRIETARY RIGHTS, AND INTEL, AND ITS CONTRIBUTORS
DISCLAIM ALL LIABILITY THEREFOR. INTEL, AND ITS CONTRIBUTORS DO NOT WARRANT THAT
ANY PRODUCT REFERENCED HEREIN OR ANY PRODUCT OR TECHNOLOGY DEVELOPED IN RELIANCE
UPON THIS DOCUMENT, IN WHOLE OR IN PART, WILL BE SUFFICIENT, ACCURATE, RELIABLE,
COMPLETE, FREE FROM DEFECTS OR SAFE FOR ITS INTENDED PURPOSE, AND HEREBY
DISCLAIM ALL LIABILITIES THEREFOR. ANY PERSON MAKING, USING OR SELLING SUCH
PRODUCT OR TECHNOLOGY DOES SO AT HIS OR HER OWN RISK.
Licenses may be
required. Intel, its contributors and others may have patents or pending patent
applications, trademarks, copyrights or other intellectual proprietary rights
covering subject matter contained or described in this document. No license,
express, implied, by estoppels or otherwise, to any intellectual property rights
of Intel or any other party is granted herein. It is your responsibility to seek
licenses for such intellectual property rights from Intel and others where
appropriate. Limited License Grant. Intel hereby grants you a limited copyright
license to copy this document for your use and internal distribution only. You
may not distribute this document externally, in whole or in part, to any other
person or entity. LIMITED LIABILITY. IN NO EVENT SHALL INTEL, OR ITS
CONTRIBUTORS HAVE ANY LIABILITY TO YOU OR TO ANY OTHER THIRD PARTY, FOR ANY LOST
PROFITS, LOST DATA, LOSS OF USE OR COSTS OF PROCUREMENT OF SUBSTITUTE GOODS OR
SERVICES, OR FOR ANY DIRECT, INDIRECT, SPECIAL OR CONSEQUENTIAL DAMAGES ARISING
OUT OF YOUR USE OF THIS DOCUMENT OR RELIANCE UPON THE INFORMATION CONTAINED
HEREIN, UNDER ANY CAUSE OF ACTION OR THEORY OF LIABILITY, AND IRRESPECTIVE OF
WHETHER INTEL, OR ANY CONTRIBUTOR HAS ADVANCE NOTICE OF THE POSSIBILITY OF SUCH
DAMAGES. THESE LIMITATIONS SHALL APPLY NOTWITHSTANDING THE FAILURE OF THE
ESSENTIAL PURPOSE OF ANY LIMITED REMEDY.
Intel and Intel logo are trademarks or registered trademarks of Intel Corporation or its subsidiaries in the United States and other countries.
*Other names and brands may be claimed as the property of others.
Copyright ? 2010, Intel Corporation. All Rights Reserved.Table of Contents
Disclaimer ii
Parallelism Tools – Checking for Thread Correctness 1
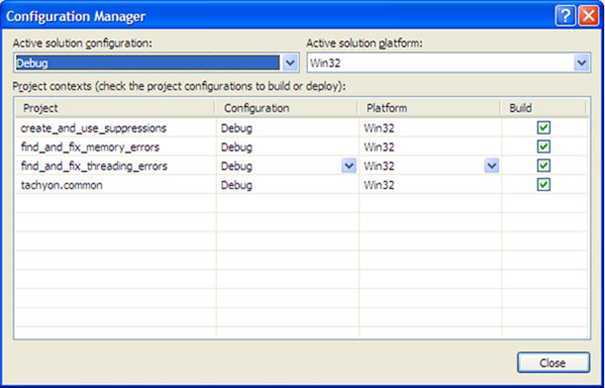
Activity 1 - Choose, Build and Run a project 1
Activity 2 - Configure and Run Analysis 9
Activity 3 - Manage result data after analysis 13
Activity 4 - Resolve, Rebuild and Rerun 21
|
Time Required |
Ten minutes |
|
Objective |
|
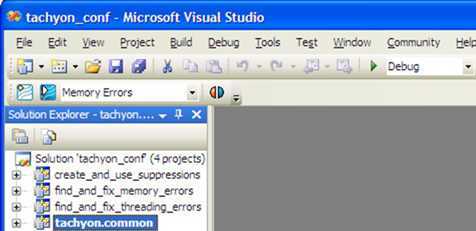
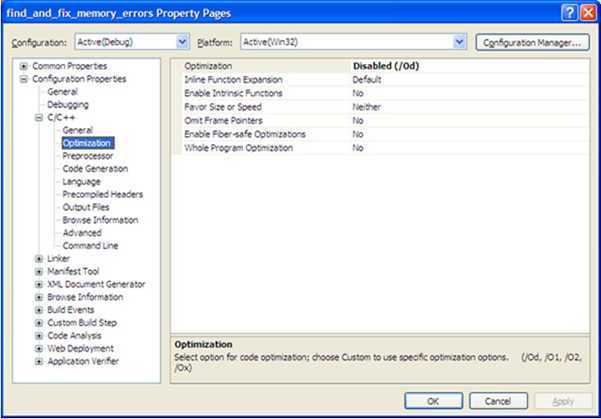
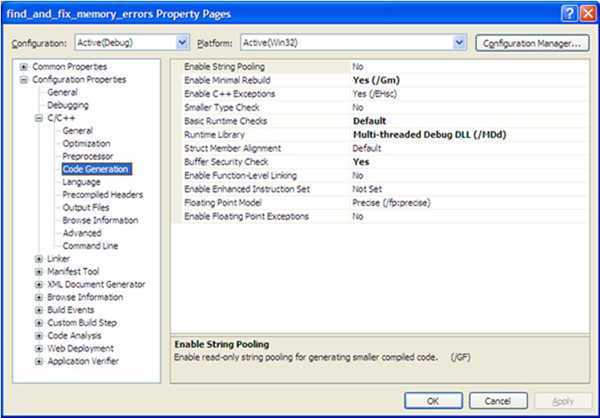
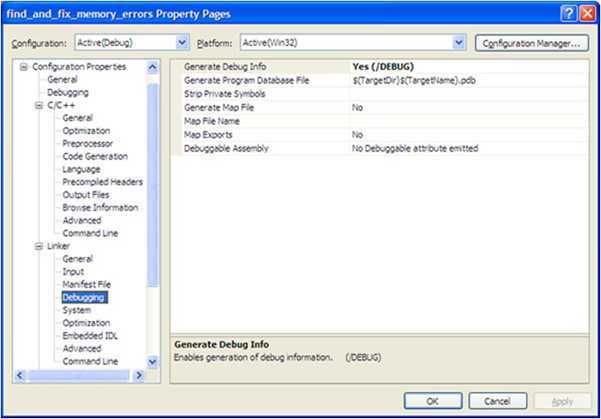
The application is a 2-D ray tracer/renderer called tachyon written in C++. The code is small enough that you may be able to identify potential memory access violations by visual inspection. If you identify and make a list of problems, check your list with the list that Parallel Inspector XE identifies.
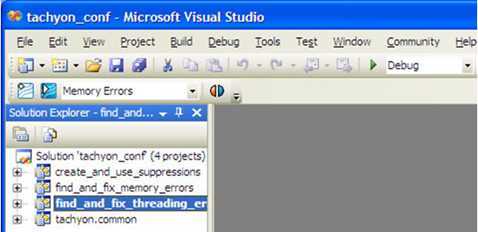
This should now display tachyon_insp_xe solution in the Solution Explorer.
|
Time Required |
Ten minutes |
|
Objective |
|
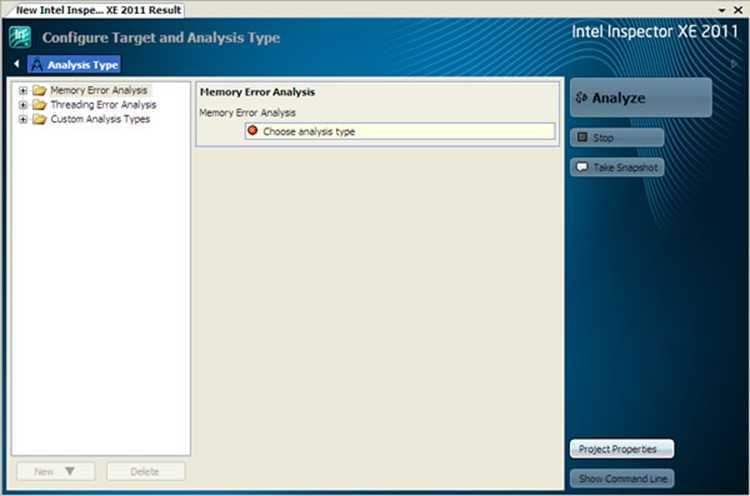
Configure a threading error analysis
 icon
in the Details region to display analysis type
characteristics.)
icon
in the Details region to display analysis type
characteristics.) 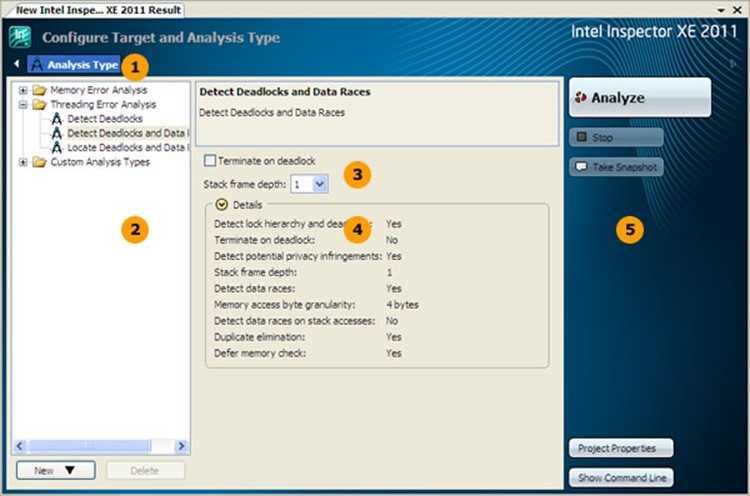
|
|
Use the Navigation toolbar to navigate among Inspector XE windows. The buttons on the toolbar vary depending on the displayed window. |
|
|
The Analysis Types region shows available preset analysis types. You can also use existing analysis types as templates to create custom analysis types. |
|
|
Use the checkbox(es) and drop-down field(s) to fine-tune some, but not all, analysis type characteristics. If you need to fine-tune more analysis type characteristics, choose another preset analysis type or create a custom analysis type. |
|
|
The Details region shows all current analysis type characteristics. Try choosing a different preset analysis type or checkbox/drop-down list value to see the impact on the Details region. |
|
|
Use the Command toolbar to control analysis runs and perform other functions. For example, use the Project Properties button to redisplay the Project Properties dialog box. |
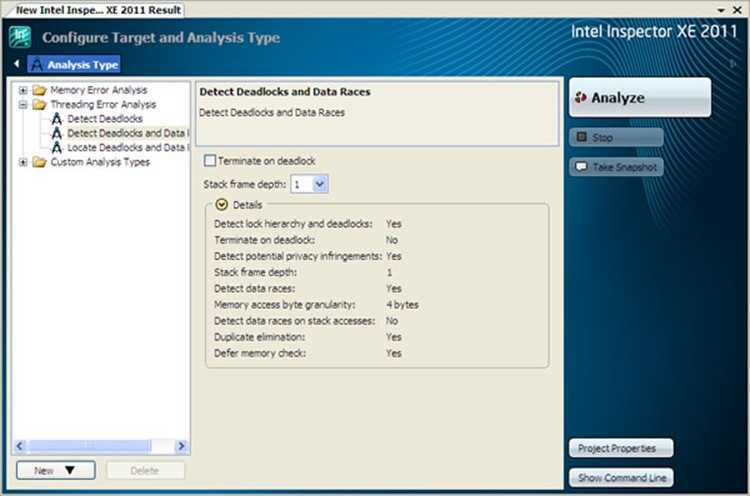
Run a threading error analysis
|
|
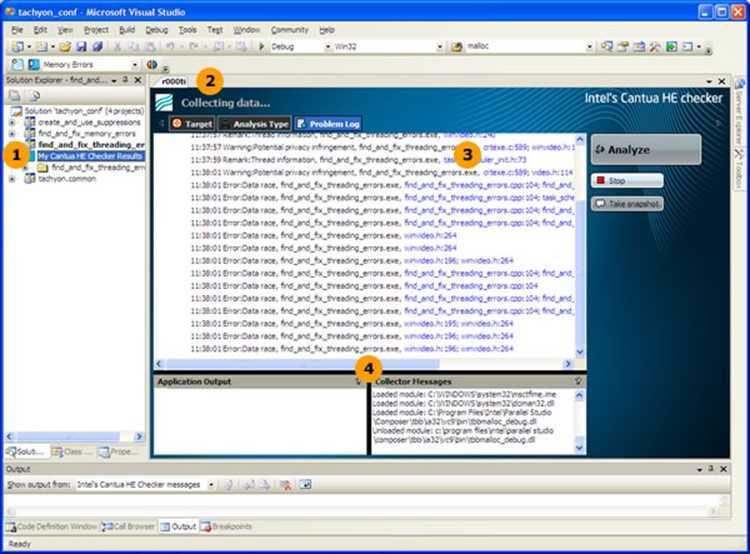
The Visual Studio* IDE offers a pointer to the result from the Solution Explorer to provide easy future access. Here, the Visual Studio* IDE created a MyInspector XE Results/find_and_fix_threading_errors folder in the Solution Explorer. Open it to see the pointer to the r000ti2 result. |
|
|
The result name appears in the tab. Here, the name of the result (and the name of the result folder in the tachyon_insp_xe\vc8\My Inspector XE 2011 Project - find_and_fix_threading_errors folder) is r000mi2, where
|
|
|
The Collection Log pane shows detected problems in real time. This tutorial does not cover examining and solving problems during collection. For more details, please check the Inspector XE Help Index for examine result during analysis. |
|
|
The Collector Messages pane shows analysis status messages. You can control where application output appears: Separate console window (as in this tutorial), Application Output pane in the Collection Log window, or Visual Studio* output window. |
|
Time Required |
Fifteen minutes |
|
Objective |
|
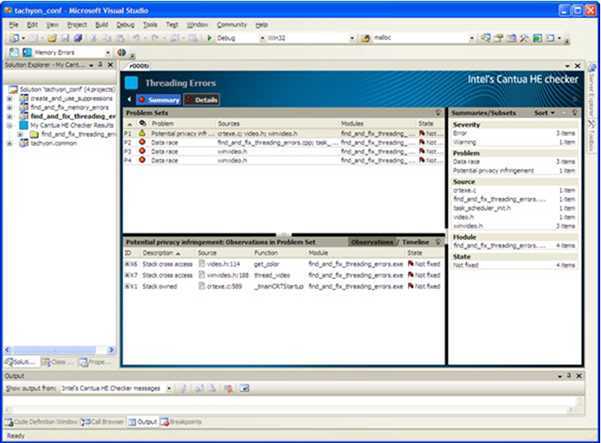
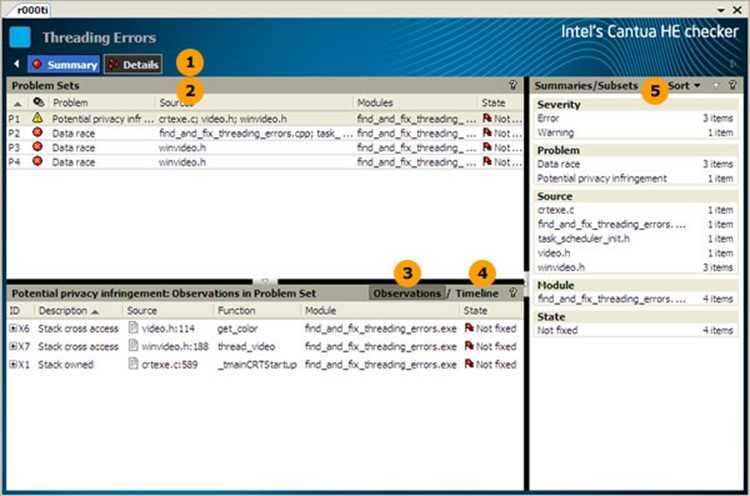
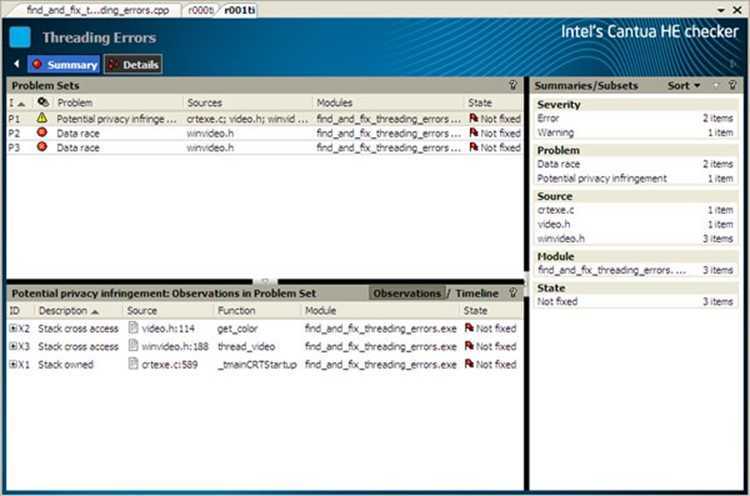
After analysis (both collection and finalization) completes successfully, the Inspector XE displays the Summary window:
Choose Problem Set
Start exploring a threading error.
Interpret the Summary window
|
|
The Summary window is the starting point for managing result data. It groups observations into problem sets, and then prioritizes the problem sets by severity and size.
Notice the arrow to the left of the Analysis Type button. Use it to revisit a read-only window showing your target project properties. |
|
|
Think of the Problem Sets pane as a to-do list. Start at the top and work your way down. |
|
|
The Observations in Problem Set pane shows all the observations in all the problems in the selected problem set. By default, the Inspector XE selects the first problem set for you.
Here, the Inspector XE selected the Invalid Memory Access problem set, which contains one problem composed of a Write observation. |
|
|
This tutorial does not cover manipulating the timeline. For more details, check the Inspector XE Help Index for manipulate timeline. |
|
|
The Summaries/Subsets pane categorizes all displayed problem sets by specific criteria. Use it to temporarily limit the list in the Problem Sets pane to only those problem sets that meet specific criteria. This tutorial does not cover searching for specific problem sets. For more details, check the Inspector XE Help Index for select/problem set search criteria. |
Choose a problem set
Click the data row for the Data race problem set in the find_and_fix_threading_errors.cpp source file to display a window similar to the following:
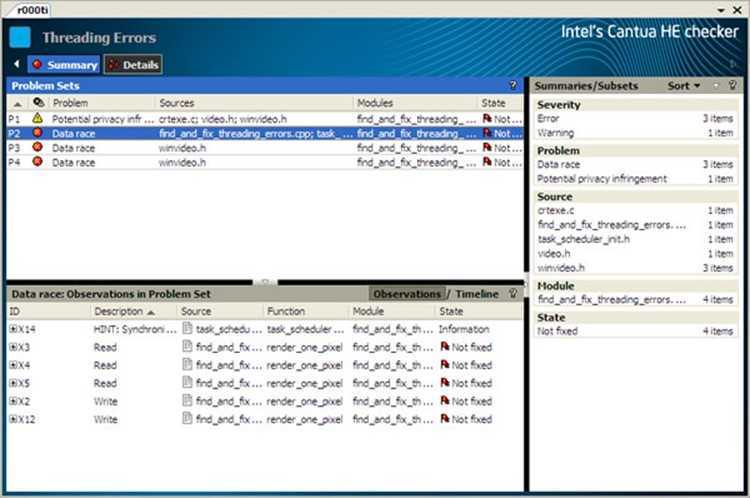
This Data race problem set contains one or more problems composed of Read and Write observations.
Choose a focus observation
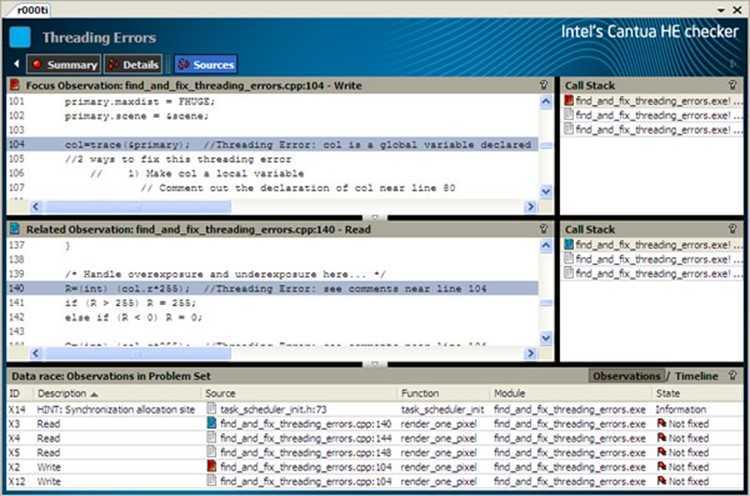
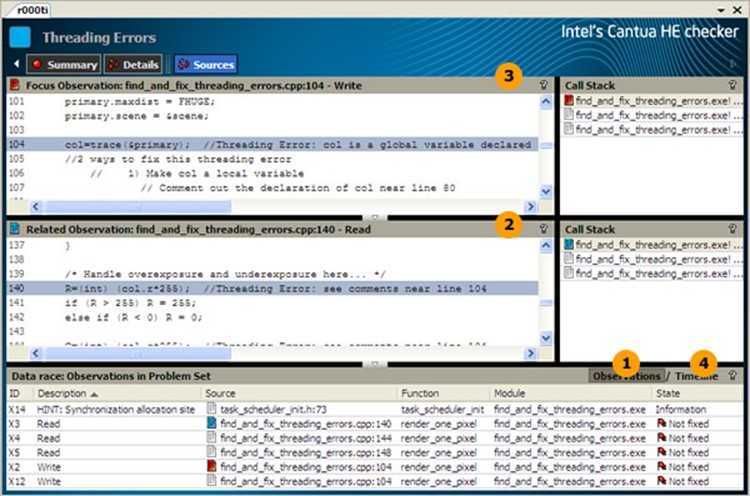
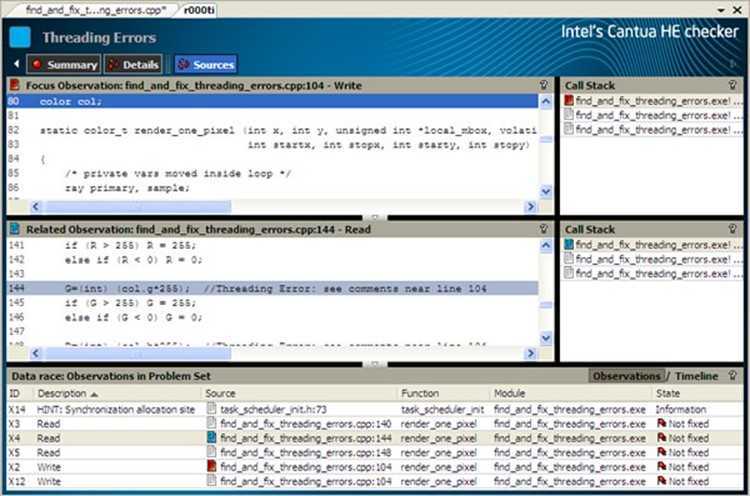
Double-click the data row for the X2 Write observation to display the Sources window, which provides more visibility into the error:
Interpret Result Data
In this section, we will see how to determine the cause of the detected threading error.
To interpret the Sources window:
|
|
Like the pane on the Summary window, the Observations in Problem Set pane shows all the observations in one Write -> Write Data race problem and three Write -> Read Data race problems in the Data race problem set. There are at least two observations in each problem. The X2 Write observation is in all problems.
| ||||||||||||
|
|
The Related Observation
Code pane shows the source code in the
find_and_fix_threading_errors.cpp source file surrounding the X3
Read observation. (Notice the | ||||||||||||
|
|
The Focus Observation
Code pane shows the source code in the
find_and_fix_threading_errors.cpp source file surrounding the X2
Write observation. (Notice the | ||||||||||||
|
|
This tutorial does not cover manipulating the timeline. For more details, check the Inspector XE Help Index for manipulate timeline | ||||||||||||
To interpret window icons:
|
Icon |
Meaning | |
|
|
This observation is the focus observation. The Inspector XE chose it for you when you double-clicked the Mismatched allocation/deallocation problem set on the Summary window. Its source code is currently displayed in the Focus Observation Code pane. |
Observation source code is available for viewing in the Inspector XE and editing in the Visual Studio* editor. |
|
|
This observation is related to the focus observation. Its source code is currently displayed in the Related Observation Code pane. | |
To view source code for another observation:
Double click the data row for the X4 Read observation in the Observations in Problem Set pane to display a window similar to the following:
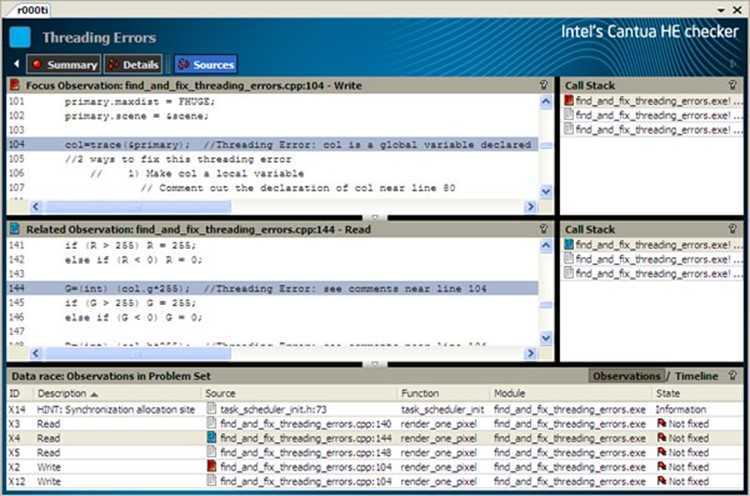
Notice the window changes:
 instead
of
instead
of  in
the Observations in Problem Set pane (and throughout the
Sources window).
in
the Observations in Problem Set pane (and throughout the
Sources window). Understand the issue:
A Write -> Write Data race problem occurs when multiple threads write to the same memory location without proper synchronization. A Write -> Read Data race problem occurs when one thread writes to, while a different thread concurrently reads from, the same memory location.
The commenting in the Focus Observation Code window identifies the cause of the Data race problems: Multiple threads are concurrently accessing the global variable col. One possible correction strategy: change the global variable to a local variable.
Access more information on interpreting and resolving problems:
|
Time Required |
Twenty minutes |
|
Objective |
|
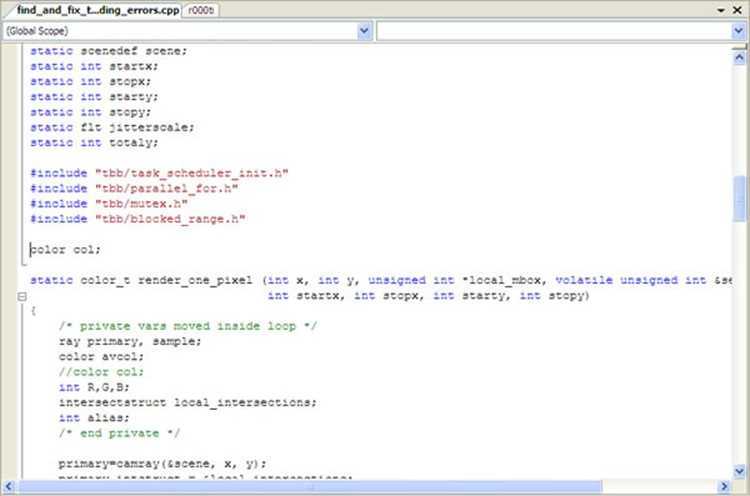
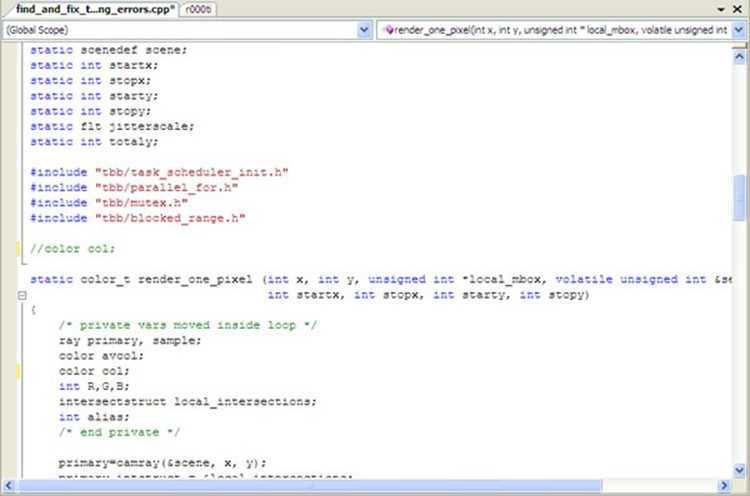
Resolve an issue:
Rebuild and Rerun Analysis
To see if your edits resolved the memory errors:
To rebuild the project:
To run another analysis:
From the Visual Studio* menu, choose Tools > Intel Inspector XE 2011 > Analyze As... > Threading Error Analysis / Detect Deadlocks and Data Races to run another analysis of the same analysis type:
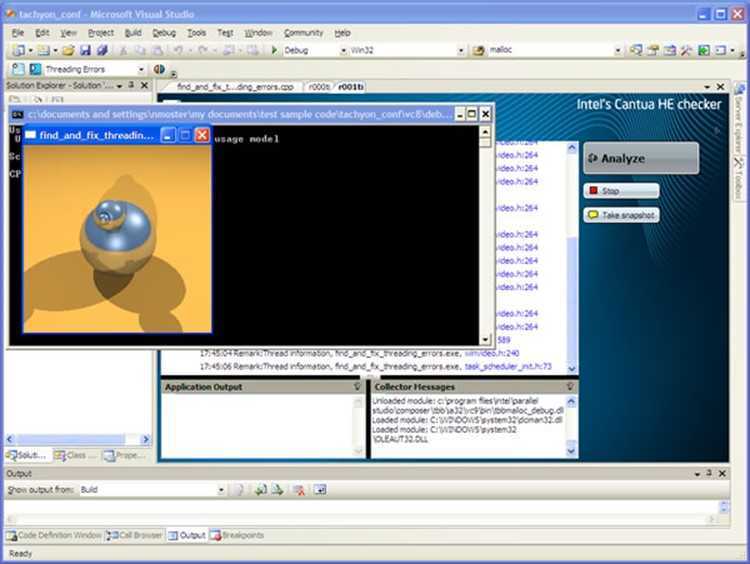
Notice the image now displays.
To start managing result data after collection:
After analysis (both collection and finalization) completes successfully, the Inspector XE displays the Summary window:
Notice the Inspector XE:
Intel 编译器 线程安全检查 真心的很详细 转,布布扣,bubuko.com
原文地址:http://www.cnblogs.com/ustc-cui/p/3753035.html


 icon
in the pane title matches the
icon
in the pane title matches the  icon
on the X3 Read observation data row in the
Observations in Problem Set window.) The source code
corresponding to the X3 Read observation is highlighted.
icon
on the X3 Read observation data row in the
Observations in Problem Set window.) The source code
corresponding to the X3 Read observation is highlighted.

 icon
in the pane title matches the
icon
in the pane title matches the  icon
on the X2 Write observation data row in the
Observations in Problem Set window.) The source code
corresponding to the X2 Write observation is highlighted.
icon
on the X2 Write observation data row in the
Observations in Problem Set window.) The source code
corresponding to the X2 Write observation is highlighted.


