标签:style blog http color 使用 strong
st-link 在win8上的支持不太好,据说是因为 st-link 硬件没有数字签名,win8 强制要求硬件必须有数字签名。虽然平时还是用的盗版 jlink 比较多一点,但是手上这块 discovery 板子只有板载的 st-link。
下载zadig
首先下载 zadig,这是一个开源的win驱动,可以让win8识别出 st-link 硬件。
下载openocd
然后下载 openocd,这相当于调试代理。优点是支持较多的仿真器。可以通过4444端口 telnet 访问进行程序烧录,或者由gdb访问3333端口进行调试。
下载完毕并将 bin 目录加入环境变量,然后输入如下命令。
$ openocd-x64-0.7.0.exe -v
Open On-Chip Debugger 0.7.0 (2013-05-05-10:44)
Licensed under GNU GPL v2
For bug reports, read
http://openocd.sourceforge.net/doc/doxygen/bugs.html
然后连上我们的硬件,再用 -f 指定板子对应的配置文件,下载下来的文件夹中已经有一些写好的配置文件,其中就有针对 discovery 板的。
$ openocd-x64-0.7.0.exe -f stm32f4discovery.cfg
Open On-Chip Debugger 0.7.0 (2013-05-05-10:44)
Licensed under GNU GPL v2
For bug reports, read
http://openocd.sourceforge.net/doc/doxygen/bugs.html
srst_only separate srst_nogate srst_open_drain connect_deassert_srst
Info : This adapter doesn‘t support configurable speed
Info : STLINK v2 JTAG v14 API v2 SWIM v0 VID 0x0483 PID 0x3748
Info : Target voltage: 2.887346
Info : stm32f4x.cpu: hardware has 6 breakpoints, 4 watchpoints
如果出现如上显示,那么恭喜,已经可以开始调试了。
telnet实现flash烧录
使用 telnet 打开本地的 4444 端口。输入如下命令,即可实现程序烧录。这里我们烧录的是 MDK 编译出来的 axf 格式文件,之所以也支持 axf,是因为 axf 本质是一种 elf 文件。
reset halt
sleep 100
flash write_image erase demo.axf
sleep 100
verify_image demo.axf
sleep 100
reset run
使用 arm-none-eabi-gdb 调试
eclipse 调试原理是一样的,只不过多了个GUI。
$ arm-none-eabi-gdb demo.axf
载入符号表。然后连接到 3333 端口。
(gdb) target remote localhost:3333
Remote debugging using localhost:3333
warning: Loadable segment "RW_IRAM1" outside of ELF segments
<Reset_Handler> ()
at ..\..\..\Libraries\CMSIS\ST\STM32F4xx\Source\Templates\arm\/startup_stm32
f4xx.s:175
175 LDR R0, =SystemInit
(gdb) monitor reset halt
target state: halted
target halted due to debug-request, current mode: Thread
xPSR: 0x01000000 pc: 0x0800019c msp: 0x20000c78
(gdb)
然后可以就可以用各种 gdb 命令调试了。
(gdb) b main
Breakpoint 1 at 0x8004546: file ..\/main.c, line 75.
(gdb) c
Continuing.
Note: automatically using hardware breakpoints for read-only addresses.
Breakpoint 1, main () at ..\/main.c:75
75 STM_EVAL_PBInit(BUTTON_USER, BUTTON_MODE_EXTI);
(gdb) s
STM_EVAL_PBInit (Button=BUTTON_USER, Button_Mode=BUTTON_MODE_EXTI)
at ..\/..\..\Utilities\STM32F4-Discovery\stm32f4_discovery.c:195
195 RCC_AHB1PeriphClockCmd(BUTTON_CLK[Button], ENABLE);
(gdb)
缺点无疑是这样太不直观。
eclipse 调试
当然首先你得有 cdt 插件,然后安装的时候记得把 gdb hardware debugging 选上,默认是不会安装的。
然后就按照图示都填好,其实图示和上面gdb原理完全一样。
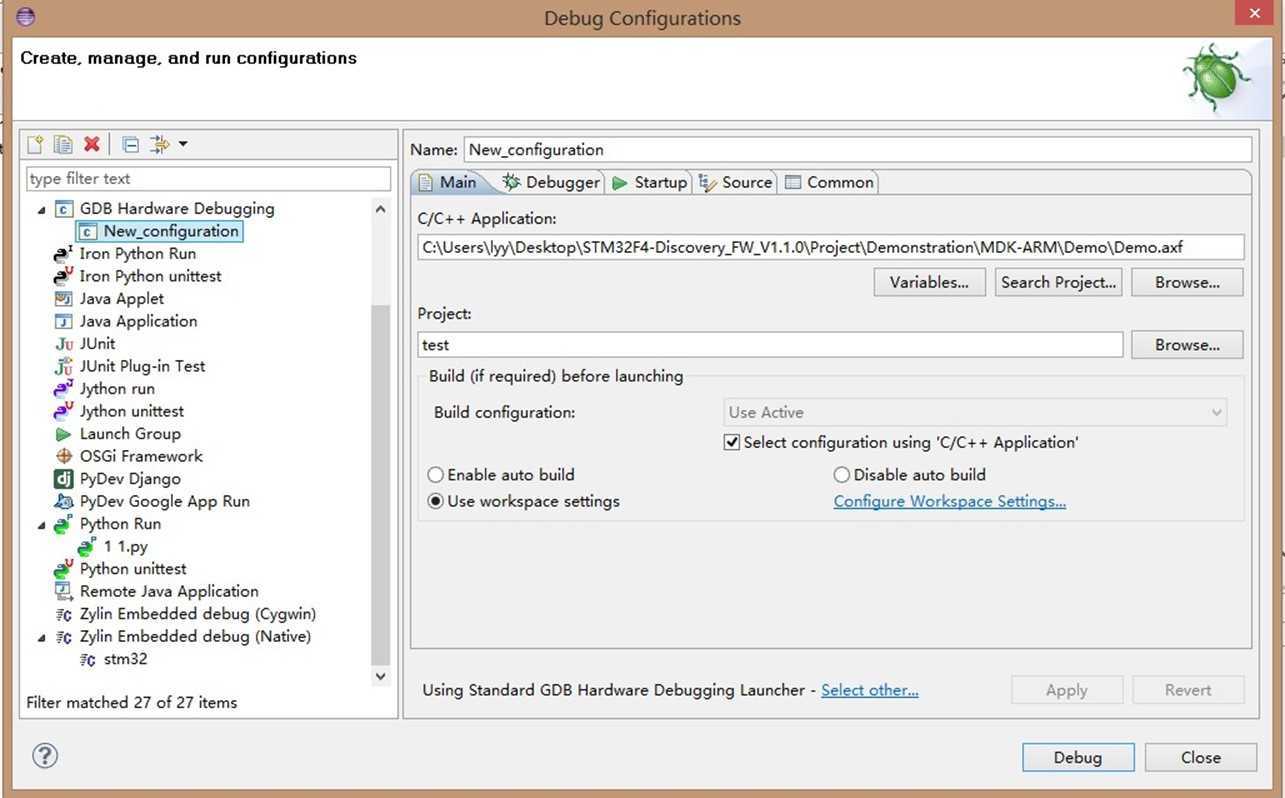
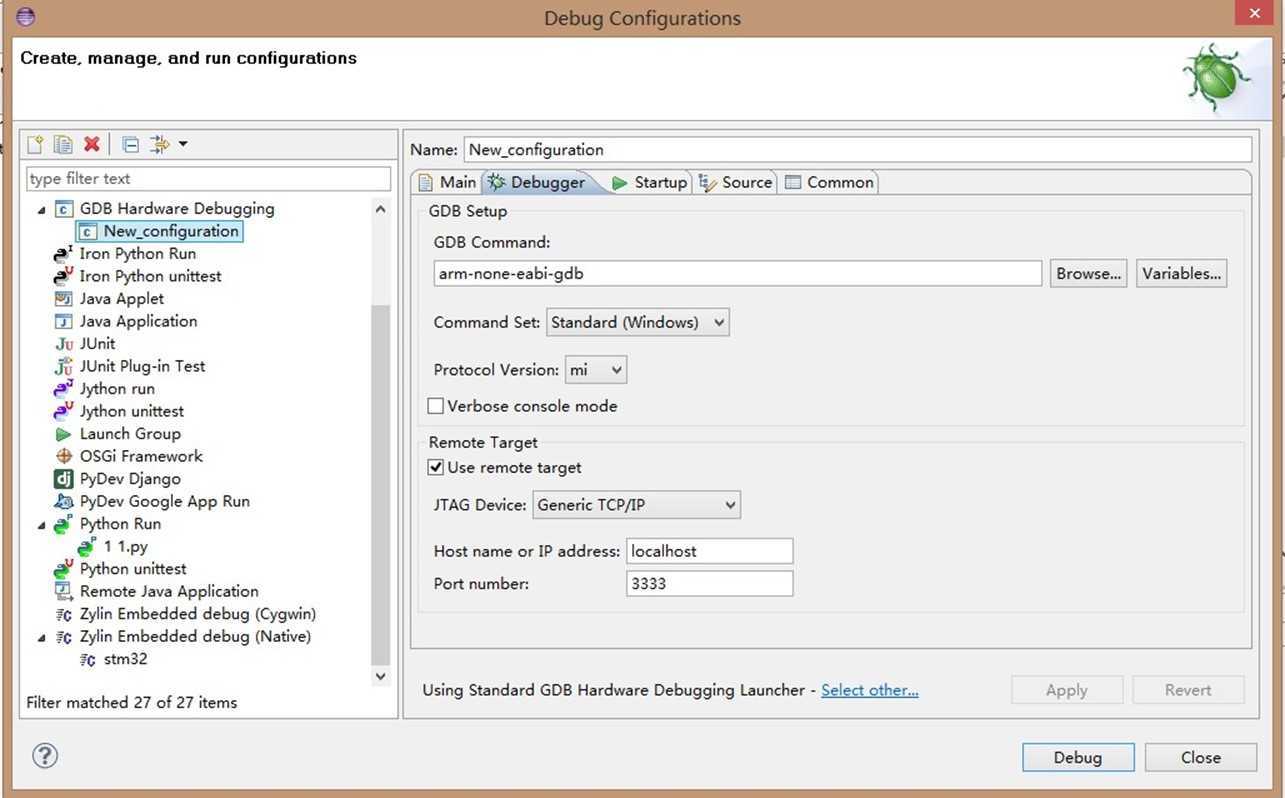
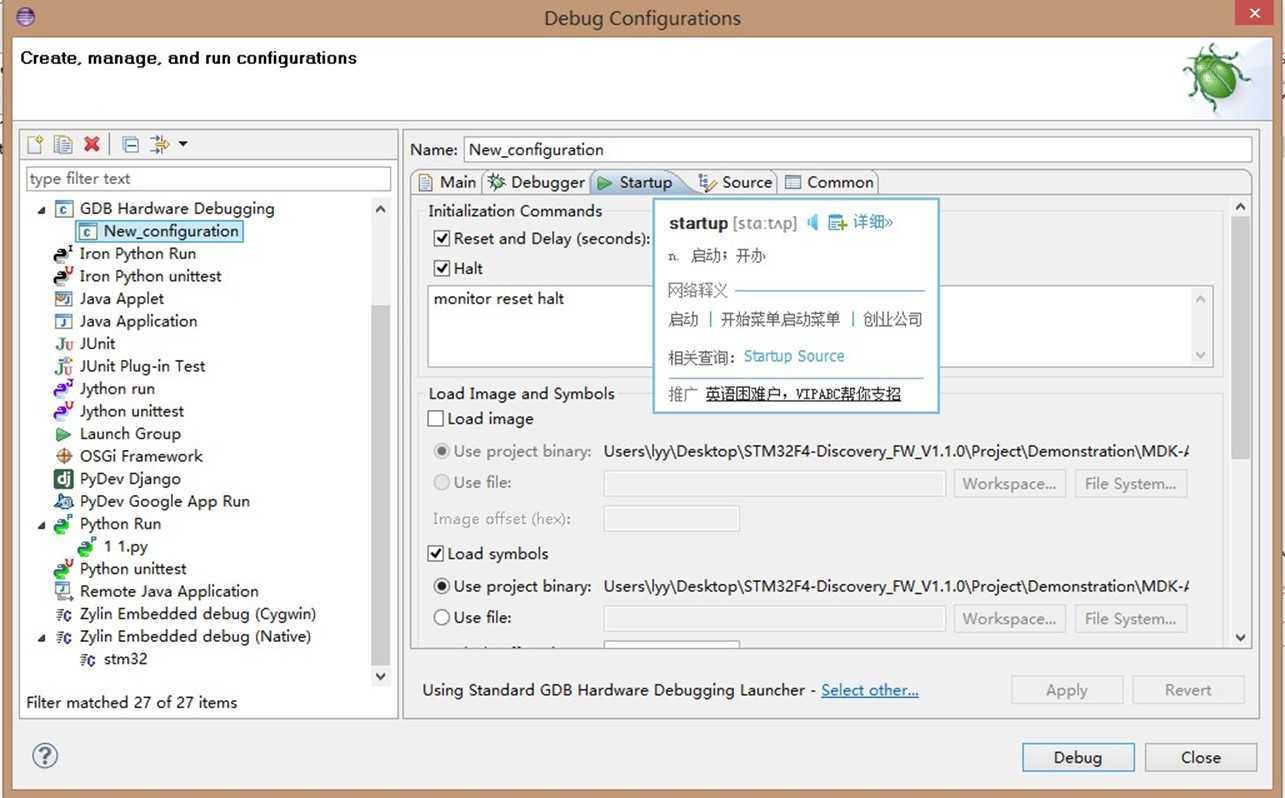
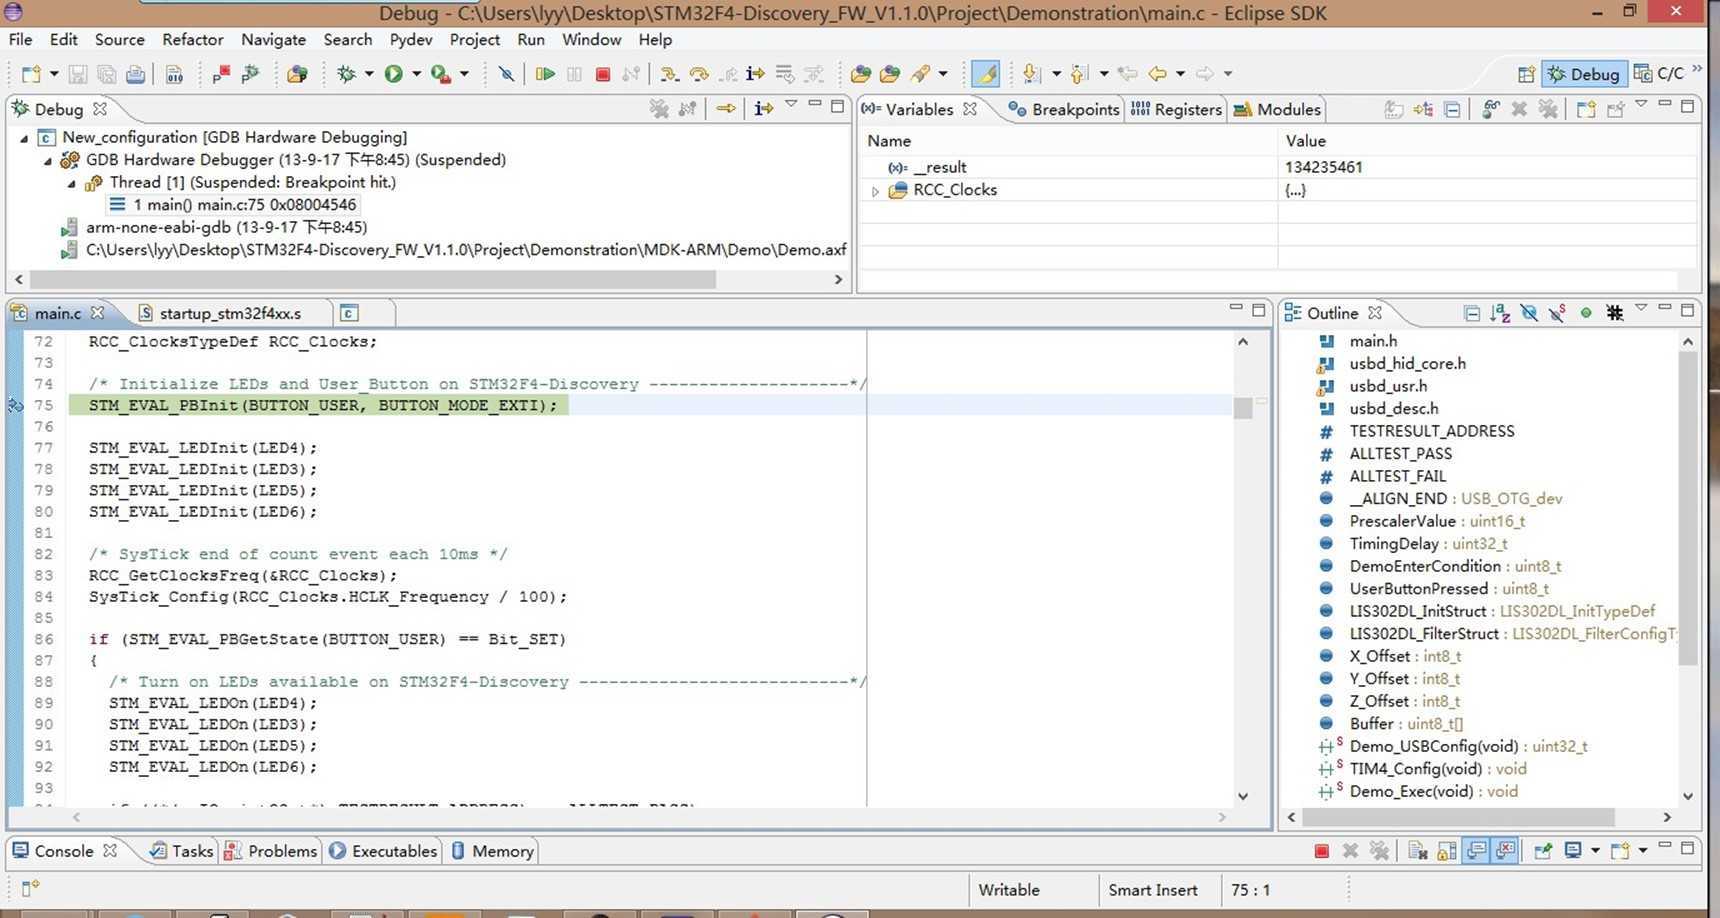
最后不用 load image,因为已经通过telnet将程序烧录了,调试eclipse只需符号表即可。下面是调试界面:
后记
当然,你如果会用 arm-none-eabi-ld,就可完全抛弃商业软件。
eclipse + st-link + openocd + gdb 开发 stm32f4,布布扣,bubuko.com
eclipse + st-link + openocd + gdb 开发 stm32f4
标签:style blog http color 使用 strong
原文地址:http://www.cnblogs.com/lyyyuna/p/3839917.html