标签:
> library(maps)
> library(geosphere)
载入需要的程辑包:sp
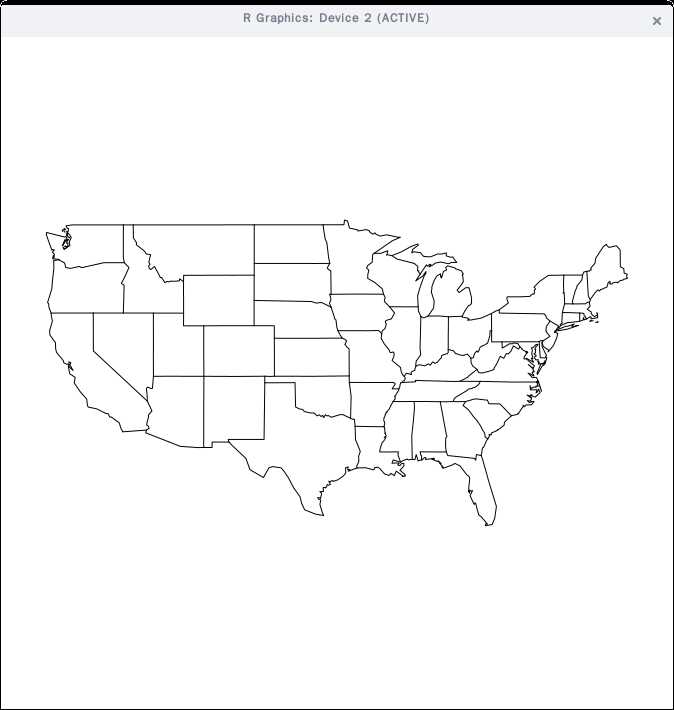
> map("state")#画美国地图
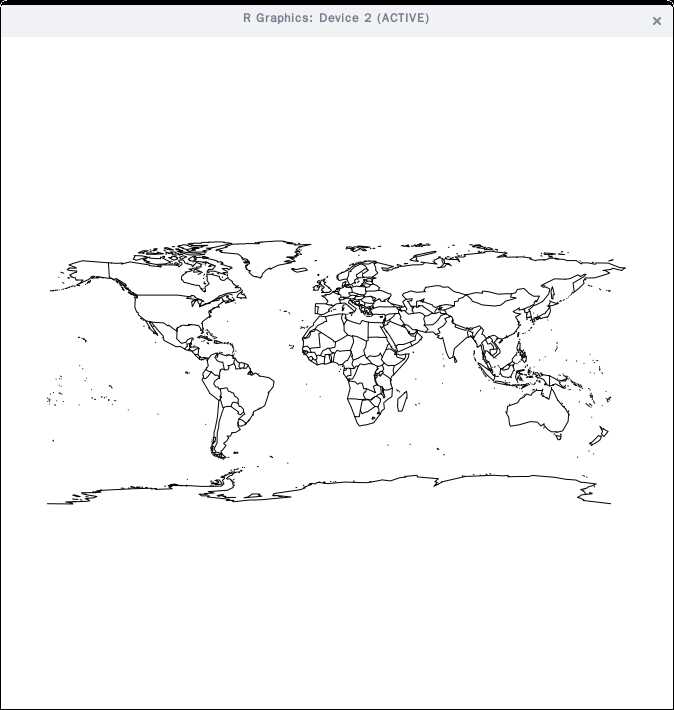
> map("world")#画世界地图
> xlim<-c(-171.738281,-56.601563)
> ylim<-c(12.039321,71.856229)
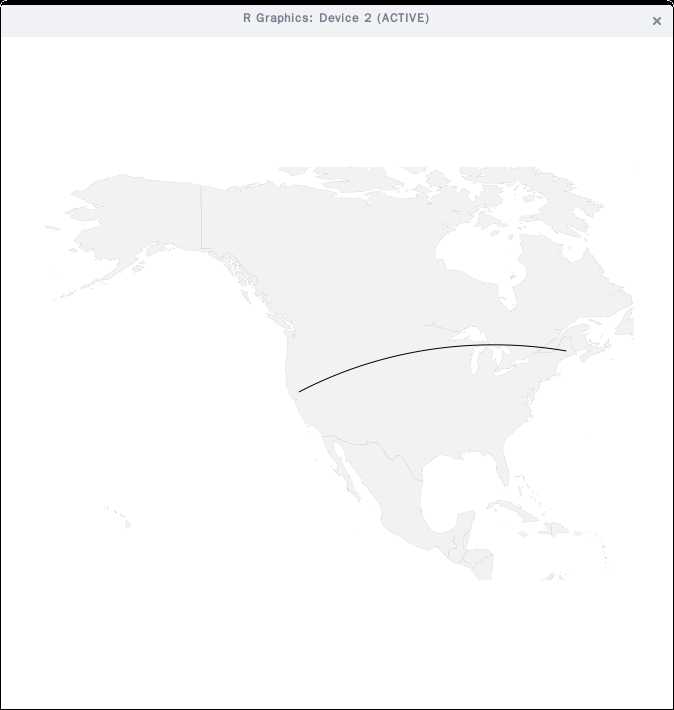
> map("world",col="#f2f2f2",fill=TRUE,bg="white",lwd=0.05,xlim=xlim,ylim=ylim)#通过设置坐标范围使焦点集中在美国周边,并且设置一些有关颜色
> #画一条弧线连线,表示社交关系
> lat_ca<-39.164141
> lon_ca<--121.64062
> lat_me<-45.21300
> lon_me<--68.906250
> gcIntermediate(c(lon_ca,lat_ca),c(lon_me,lat_me),n=50,addStartEnd=TRUE)
             lon      lat
 [1,] -121.64062 39.16414
 [2,] -120.75830 39.50191
 [3,] -119.86744 39.83294
 [4,] -118.96805 40.15709
 [5,] -118.06012 40.47422
 [6,] -117.14367 40.78418
 [7,] -116.21873 41.08682
 [8,] -115.28534 41.38199
 [9,] -114.34355 41.66956
[10,] -113.39342 41.94937
[11,] -112.43503 42.22127
[12,] -111.46848 42.48513
[13,] -110.49386 42.74080
[14,] -109.51131 42.98815
[15,] -108.52095 43.22701
[16,] -107.52295 43.45727
[17,] -106.51746 43.67879
[18,] -105.50466 43.89143
[19,] -104.48477 44.09506
[20,] -103.45798 44.28955
[21,] -102.42454 44.47479
[22,] -101.38468 44.65065
[23,] -100.33866 44.81702
[24,]  -99.28677 44.97379
[25,]  -98.22930 45.12084
[26,]  -97.16654 45.25810
[27,]  -96.09881 45.38544
[28,]  -95.02646 45.50280
[29,]  -93.94981 45.61008
[30,]  -92.86924 45.70722
[31,]  -91.78510 45.79413
[32,]  -90.69778 45.87075
[33,]  -89.60766 45.93704
[34,]  -88.51513 45.99294
[35,]  -87.42060 46.03841
[36,]  -86.32447 46.07342
[37,]  -85.22717 46.09793
[38,]  -84.12909 46.11194
[39,]  -83.03067 46.11543
[40,]  -81.93232 46.10840
[41,]  -80.83445 46.09085
[42,]  -79.73750 46.06280
[43,]  -78.64186 46.02427
[44,]  -77.54796 45.97529
[45,]  -76.45620 45.91589
[46,]  -75.36698 45.84611
[47,]  -74.28068 45.76602
[48,]  -73.19770 45.67566
[49,]  -72.11841 45.57510
[50,]  -71.04317 45.46442
[51,]  -69.97234 45.34369
[52,]  -68.90625 45.21300
>
> inter<-
+ gcIntermediate(c(lon_ca,lat_ca),c(lon_me,lat_me),n=50,addStartEnd=TRUE)
> lines(inter)
> #转载数据
> airports<-read.csv("http://datasets.flowingdata.com/tuts/maparcs/airports.csv",header=TRUE)
> flights<-read.csv("http://datasets.flowingdata.com/tuts/maparcs/flights.csv",header=TRUE,as.is=TRUE)
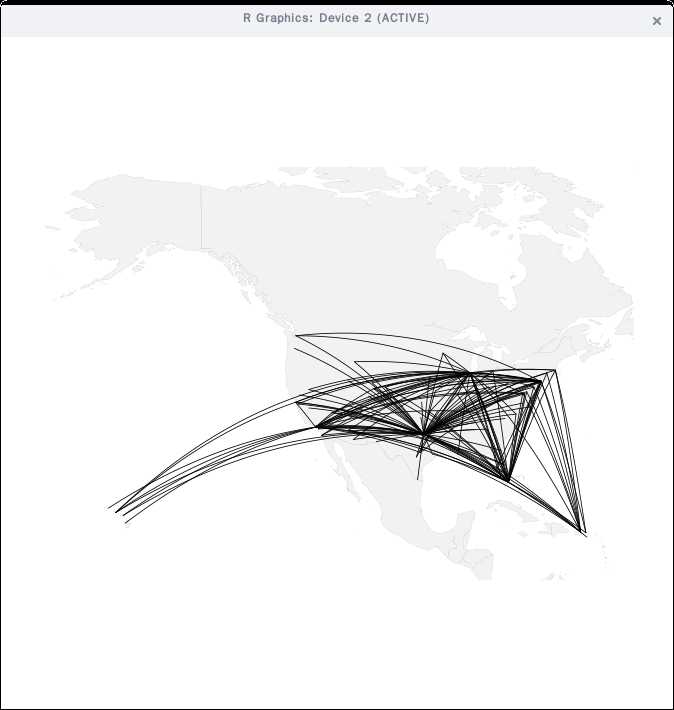
> #实现多重联系
> map("world",col="#f2f2f2",fill=TRUE,bg="white",lwd=0.05,xlim=xlim,ylim=ylim)
> fsub<-flights[flights$airline=="AA",]
> for(j in 1:length(fsub$airline)){
+ air1<-airports[airports$iata==fsub[j,]$airport1,]
+ air2<-airports[airports$iata==fsub[j,]$airport2,]
+ inter<-gcIntermediate(c(air1[1,]$long,air1[1,]$lat),c(air2[1,]$long,air2[1,]$lat),n=100,addStartEnd=TRUE)
+ lines(inter,col="black",lwd=0.8)
+ }
>
标签:
原文地址:http://www.cnblogs.com/XBlack/p/4868295.html