标签:
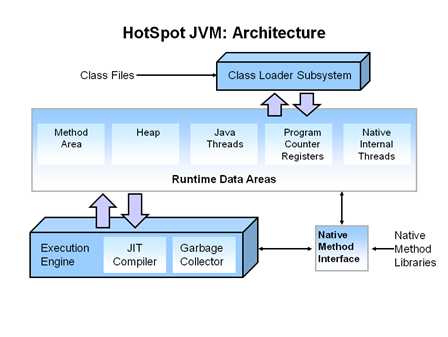
HotSpot JVM comprises three main components: the class loader, the runtime data areas and the execution engine.
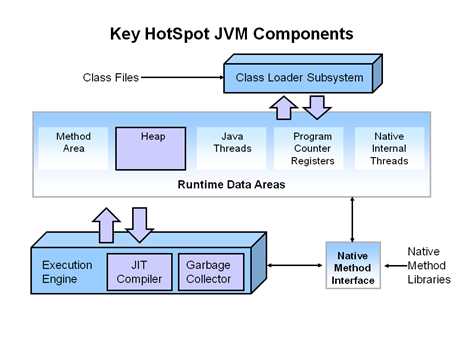
There are three key components related to tune performance: the heap, the JIT compiler and the garbage collector. However, the JIT compiler is usually used to generate dynamically more efficient the native machine code. So it doesn‘t need to be tuned during running process with the latest versions of the JVM.
JVM tuning performance is focused on setting a proper heap size and choosing the most appropriate garbage collector.
Responsiveness and throughput are two basic targets for performance.
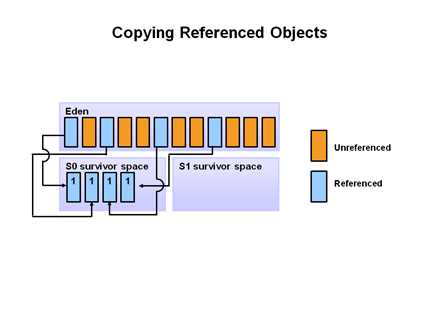
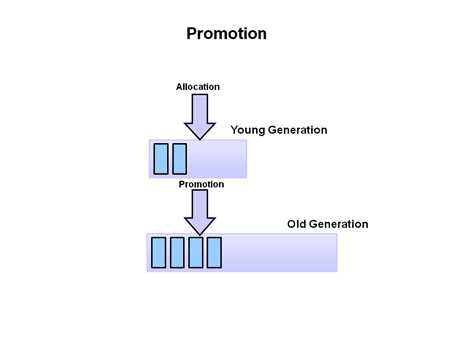
Automatic garbage collection is looking at heap memory, finding which objects are used and which ones are not used. Delete the unused objects and deallocate them. The memory used can be reclaimed.
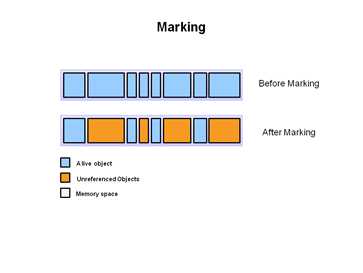
The process marks which objects are unreferenced and which objects are referenced.
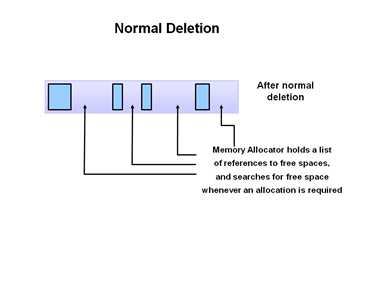
Remove the unreferenced objects and leave referenced objects and free memory pointers.
Step2a: Deletion with compacting
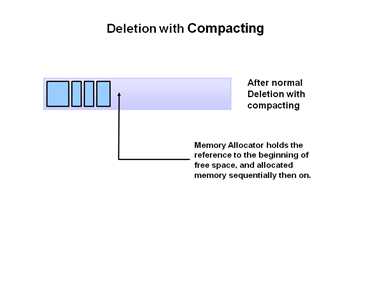
In addition to remove unreferenced objects, move the referenced objects together. Make new memory reallocation easier and faster.
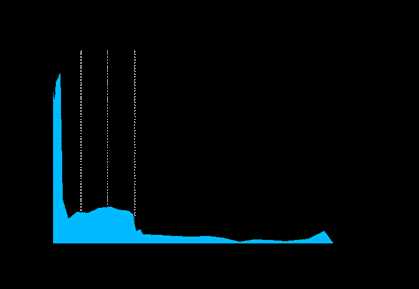
Y axis: the amount of bytes allocated;
X axis: X access shows the total numbers of bytes over time.(X axis represents time)
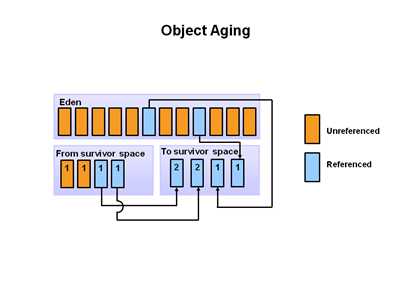
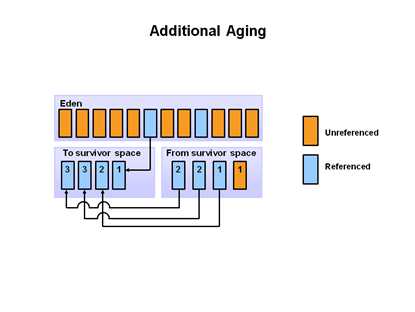
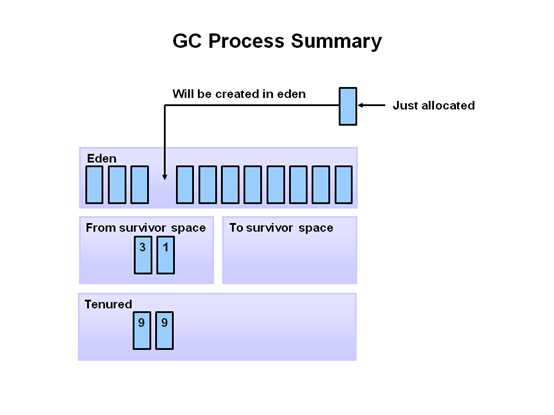
Empirical analysis of applications show most of the objects have a short lived.
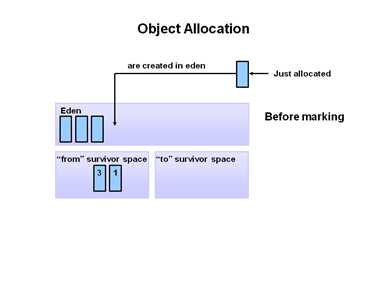
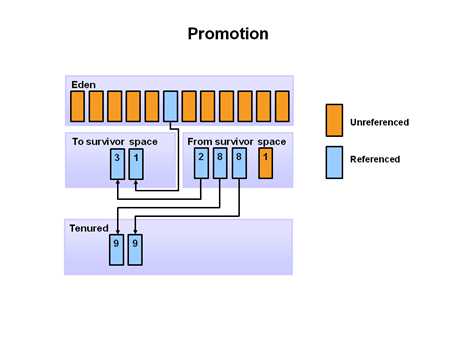
1,3 represents the object‘s age.

Switches | Description |
-Xmx | Set the maximum heap size |
-Xms | Set the initial heap size |
-Xmn | Set the size of the young generation |
-XX:PermSize | Set the starting size of the permanent generation |
-XX:MaxPermSize | Set the maximum of the permanent generation |
The default GC collector is used by client style machine in JavaSE5 and 6. Both minor and major GC are done serially by a single visual CPU. It uses mark and compact collection method.
Applications don‘t have low pause requirement. Client-style machines. One machine runs many JVMs.
To enable the serial GC: -XX:+UseSerialGC
E.g. java –Xmx –Xms –Xmn –XX:PermSize=20m –XX:MaxPermSize=20m –XX:UseSerialGC –jar c:\javademos\demo\jfc\Java2D\Java2demo.jar
Uses the multiple thread to do the young generation garbage collection. By default, on the N CPUs machine it uses N parallel garbage collector threads to do the collection. The amount of the parallel threads can be controlled by the command-line options:
-XX:ParallelGCThreads=<desired number>
This collector is called a throughput collector, which is used in a high throughput requirement environment with long pauses accepted.
-XX:UseParallelGC
Use multi-thread young generation collector, single-thread old generation collector with a compaction of old generation.
E.g. java -Xmx12m -Xms3m -Xmn1m -XX:PermSize=20m -XX:MaxPermSize=20m -XX:+UseParallelGC -jar c:\javademos\demo\jfc\Java2D\Java2demo.jar
-XX:UseParallelOldGC
Both young generation and old use multi-thread collectors. Only old generation GC uses compaction method.
E.g. java -Xmx12m -Xms3m -Xmn1m -XX:PermSize=20m -XX:MaxPermSize=20m -XX:+UseParallelOldGC -jar c:\javademos\demo\jfc\Java2D\Java2demo.jar
The concurrent mark sweep collector also refers to as the concurrent low pause collector, which is used to collector the tenured generation, running at the same time with applications. It uses the same algorithm as the parallel collector on the young generation.
Require low pauses and share resources with applications.
To enable the CMS collector: -XX:+UseConcMarkSweepGC
Set the number of threads: -XX:ParrallelCMSThread=<desired number>
E.g. java -Xmx12m -Xms3m -Xmn1m -XX:PermSize=20m -XX:MaxPermSize=20m -XX:+UseConcMarkSweepGC -XX:ParallelCMSThreads=2 -jar c:\javademos\demo\jfc\Java2D\Java2demo.jar
http://www.oracle.com/webfolder/technetwork/tutorials/obe/java/G1GettingStarted/index.html
?
The G1 is available in Java 7 and is purposed to instead of the CMS collector, which is concurrent, parallel, low-pause collector. I‘ll make note for the details about G1 in the following paragraph.
Enable G1: -XX:+UseG1GC
E.g. java -Xmx12m -Xms3m -XX:+UseG1GC -jar c:\javademos\demo\jfc\Java2D\Java2demo.jar
In conclude, the OBE(Oracle by Example) includes:
| ? | The serial collector | The parallel collector | The concurrent mark sweep | The G1 |
Stop the World | Yes | ? | ? | ? |
Support Minor garbage collection | ? | ? | ? | ? |
Support Major garbage collection | ? | ? | ? | ? |
Support Full garbage collection | ? | ? | ? | ? |
Compact | ? | ? | ? | ? |
Command line | ? | ? | ? | ? |
Use case | ? | ? | ? | ? |
| ? | ? | ? | ? | ? |
| ? | Minor GC | Major GC | Full GC |
Stop the World | Y | ? | ? |
The trigger point | When free spaces can‘t be allocated for new objects | Minor GC often triggers major GC | ? |
Process | 1,Copy Objects referenced From eden, survivor to another survivor. 2,Clean up eden, survivor. | ? | ? |
Latency issues | 1, If there are lots of live objects in young generation heap, minor gc will cost much more time | ? | ? |
?
[root@service02 ~]# jps -l -l -m
3974 sun.tools.jps.Jps -l -l -m
28093 org.apache.catalina.startup.Bootstrap start
?
[root@service02 ~]# top -Hp 28093
--the line in red is the thread which costs the most time
top - 09:57:27 up 202 days, 9:19, 1 user, load average: 0.05, 0.03, 0.00
Tasks: 58 total, 0 running, 58 sleeping, 0 stopped, 0 zombie
Cpu(s): 0.8%us, 0.4%sy, 0.0%ni, 98.7%id, 0.0%wa, 0.0%hi, 0.0%si, 0.0%st
Mem: 32878972k total, 30914832k used, 1964140k free, 156240k buffers
Swap: 8388604k total, 89048k used, 8299556k free, 24949784k cached
?
PID USER PR NI VIRT RES SHR S %CPU %MEM TIME+ COMMAND
28146 root 20 0 12.9g 4.4g 12m S 1.0 13.9 1:26.10 java
28171 root 20 0 12.9g 4.4g 12m S 0.7 13.9 1:26.26 java
28141 root 20 0 12.9g 4.4g 12m S 0.3 13.9 0:06.77 java
28142 root 20 0 12.9g 4.4g 12m S 0.3 13.9 1:26.51 java
28144 root 20 0 12.9g 4.4g 12m S 0.3 13.9 1:25.39 java
28152 root 20 0 12.9g 4.4g 12m S 0.3 13.9 1:25.84 java
28158 root 20 0 12.9g 4.4g 12m S 0.3 13.9 1:25.26 java
28164 root 20 0 12.9g 4.4g 12m S 0.3 13.9 1:26.22 java
28165 root 20 0 12.9g 4.4g 12m S 0.3 13.9 1:25.80 java
28181 root 20 0 12.9g 4.4g 12m S 0.3 13.9 0:33.08 java
28093 root 20 0 12.9g 4.4g 12m S 0.0 13.9 0:00.00 java
28094 root 20 0 12.9g 4.4g 12m S 0.0 13.9 0:01.12 java
28095 root 20 0 12.9g 4.4g 12m S 0.0 13.9 0:03.38 java
28096 root 20 0 12.9g 4.4g 12m S 0.0 13.9 0:03.45 java
28097 root 20 0 12.9g 4.4g 12m S 0.0 13.9 0:03.51 java
28098 root 20 0 12.9g 4.4g 12m S 0.0 13.9 0:03.48 java
28099 root 20 0 12.9g 4.4g 12m S 0.0 13.9 0:14.24 java
28100 root 20 0 12.9g 4.4g 12m S 0.0 13.9 0:07.59 java
28101 root 20 0 12.9g 4.4g 12m S 0.0 13.9 0:00.59 java
28102 root 20 0 12.9g 4.4g 12m S 0.0 13.9 0:00.67 java
28103 root 20 0 12.9g 4.4g 12m S 0.0 13.9 0:00.00 java
28104 root 20 0 12.9g 4.4g 12m S 0.0 13.9 0:00.00 java
28105 root 20 0 12.9g 4.4g 12m S 0.0 13.9 0:34.41 java
28106 root 20 0 12.9g 4.4g 12m S 0.0 13.9 0:34.18 java
28107 root 20 0 12.9g 4.4g 12m S 0.0 13.9 0:00.00 java
***********************
-H : Threads toggle
Starts top with the last remembered ‘H‘ state reversed. When this toggle is On, all individual
threads will be displayed. Otherwise, top displays a summation of all threads in a process.
***********************
?
[root@service02 ~]# printf "%x\n" 28142
6dee
[root@service02 ~]# jstack 28093|grep 6dee
"http-bio-8080-exec-1" daemon prio=10 tid=0x00007fa69c001800 nid=0x6dee waiting on condition [0x00007fa6fe97e000]
[root@service02 ~]#
?
-- http://docs.oracle.com/javase/7/docs/technotes/tools/share/jmap.html
Reference to the link for jmap.
Jmap -dump:format=b,file=/home/jmap.dat 25886 --export a binary format dump heap file
?
[root@service01 ~]# jmap -heap 25886
Attaching to process ID 25886, please wait...
Debugger attached successfully.
Server compiler detected.
JVM version is 24.65-b04
?
using parallel threads in the new generation.
using thread-local object allocation.--Applied to small and medium objects
Concurrent Mark-Sweep GC
?
Heap Configuration:
MinHeapFreeRatio = 40
MaxHeapFreeRatio = 70
MaxHeapSize = 10737418240 (10240.0MB)
NewSize = 5368709120 (5120.0MB)
MaxNewSize = 5368709120 (5120.0MB)
OldSize = 5439488 (5.1875MB)
NewRatio = 2--
SurvivorRatio = 6--
PermSize = 134217728 (128.0MB)
MaxPermSize = 536870912 (512.0MB)
G1HeapRegionSize = 0 (0.0MB)
?
Heap Usage:
New Generation (Eden + 1 Survivor Space):
capacity = 4697620480 (4480.0MB)
used = 2608958240 (2488.096466064453MB)
free = 2088662240 (1991.9035339355469MB)
55.53786754608154% used
Eden Space:
capacity = 4026531840 (3840.0MB)
used = 2500600448 (2384.7584228515625MB)
free = 1525931392 (1455.2415771484375MB)
62.10308392842611% used
From Space:
capacity = 671088640 (640.0MB)
used = 108357792 (103.33804321289062MB)
free = 562730848 (536.6619567871094MB)
16.14656925201416% used
To Space:
capacity = 671088640 (640.0MB)
used = 0 (0.0MB)
free = 671088640 (640.0MB)
0.0% used
concurrent mark-sweep generation:
capacity = 5368709120 (5120.0MB)
used = 0 (0.0MB)
free = 5368709120 (5120.0MB)
0.0% used
Perm Generation:
capacity = 134217728 (128.0MB)
used = 78244312 (74.61959075927734MB)
free = 55973416 (53.380409240722656MB)
58.296555280685425% used
?
42874 interned Strings occupying 4766144 bytes.
[root@service01 ~]#
?
http://docs.oracle.com/javase/7/docs/technotes/tools/share/jstat.html
Reference to the link.
jstat -gcnew -h3 21891 250
?
S0C S1C S0U S1U TT MTT DSS EC EU YGC YGCT
?
64.0 64.0 0.0 31.7 31 31 32.0 512.0 178.6 249 0.203
?
64.0 64.0 0.0 31.7 31 31 32.0 512.0 355.5 249 0.203
?
64.0 64.0 35.4 0.0 2 31 32.0 512.0 21.9 250 0.204
?
S0C S1C S0U S1U TT MTT DSS EC EU YGC YGCT
?
64.0 64.0 35.4 0.0 2 31 32.0 512.0 245.9 250 0.204
?
64.0 64.0 35.4 0.0 2 31 32.0 512.0 421.1 250 0.204
?
64.0 64.0 0.0 19.0 31 31 32.0 512.0 84.4 251 0.204
?
S0C S1C S0U S1U TT MTT DSS EC EU YGC YGCT
?
64.0 64.0 0.0 19.0 31 31 32.0 512.0 306.7 251 0.204
?
In addition to showing the repeating header string, this example shows that between the 2nd and 3rd sam-
ples, a young GC occurred. Its duration was 0.001 seconds. The collection found enough live data that the
survivor space 0 utilization (S0U) would would have exceeded the desired survivor Size (DSS). As a result,
objects were promoted to the old generation (not visible in this output), and the tenuring threshold (TT)
was lowered from 31 to 2.
?
Another collection occurs between the 5th and 6th samples. This collection found very few survivors and
returned the tenuring threshold to 31.
TLAB: thread local allocation byte
-XX:+PrintVMOptions -XX:+AggressiveOpts -XX:+UnlockDiagnosticVMOptions -XX:+UnlockExperimentalVMOptions -XX:+PrintFlagsFinal
--The above options print all JVM parameters.
?
byte[] hugeObject = new byte[300*1024*1024];
????????//-Xmx1500m -Xms1500m -Xmn500m -XX:PretenureSizeThreshold=100000000 -XX:+PrintGCDetails
????????//If new generation is set less than the object‘s size, it will be allocated directly in old generation
????????//By adjusting Xmx to demonstrate huge object allocation process. e.g. Xmx=600m,610m, Xmn=300
for(MemoryPoolMXBean memoryPoolMXBean : ManagementFactory.getMemoryPoolMXBeans()){
????????????????System.out.println(memoryPoolMXBean.getName());
????????????????System.out.println(memoryPoolMXBean.getUsage().getUsed());
}
If an object‘s size is larger than the young generation space, JVM will allocate it in the tenure generation space directly.
HotSpot JVM and GC basics study note
标签:
原文地址:http://www.cnblogs.com/peter2016/p/5147816.html