标签:
You can debug with chrom dev tool:
1. Use console to debug service worker:
Swith to sw.js context then you can access ‘self‘ object
2. Set breakpoint:
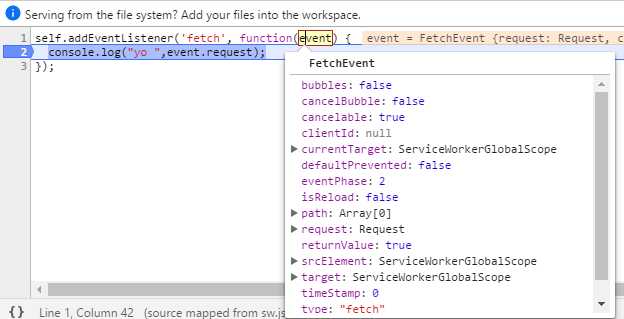
You can see all the event object.
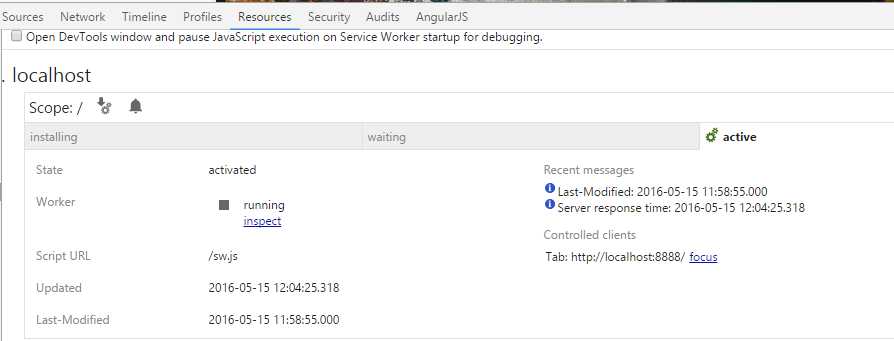
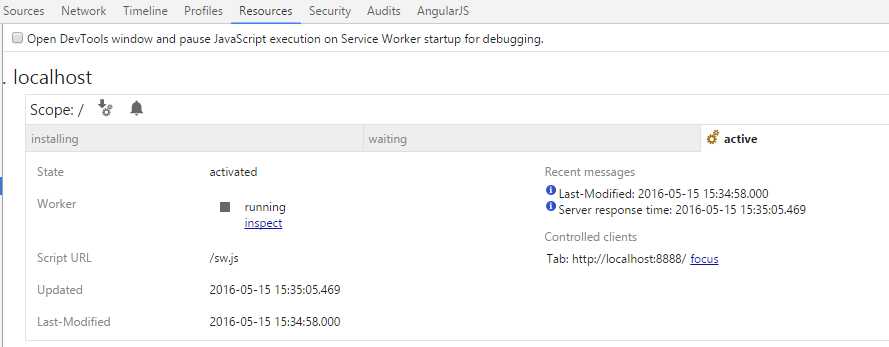
3. You can see the active service worker:
4. Once you change the code, you can see the waiting servie worker:
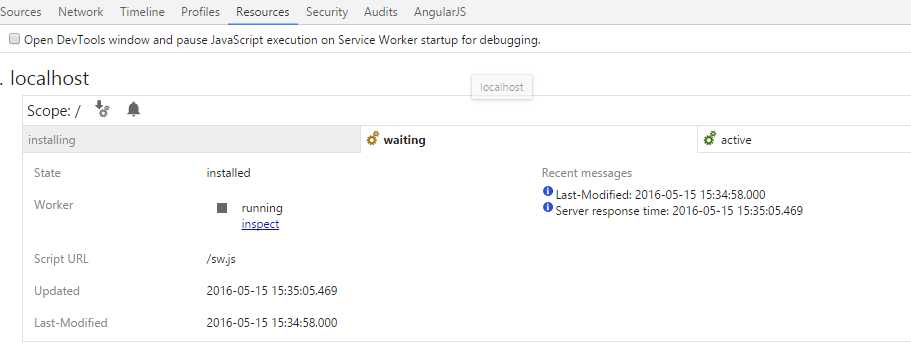
4. After you close and reopen the page, the waiting service work become the active one.
标签:
原文地址:http://www.cnblogs.com/Answer1215/p/5496129.html