标签:
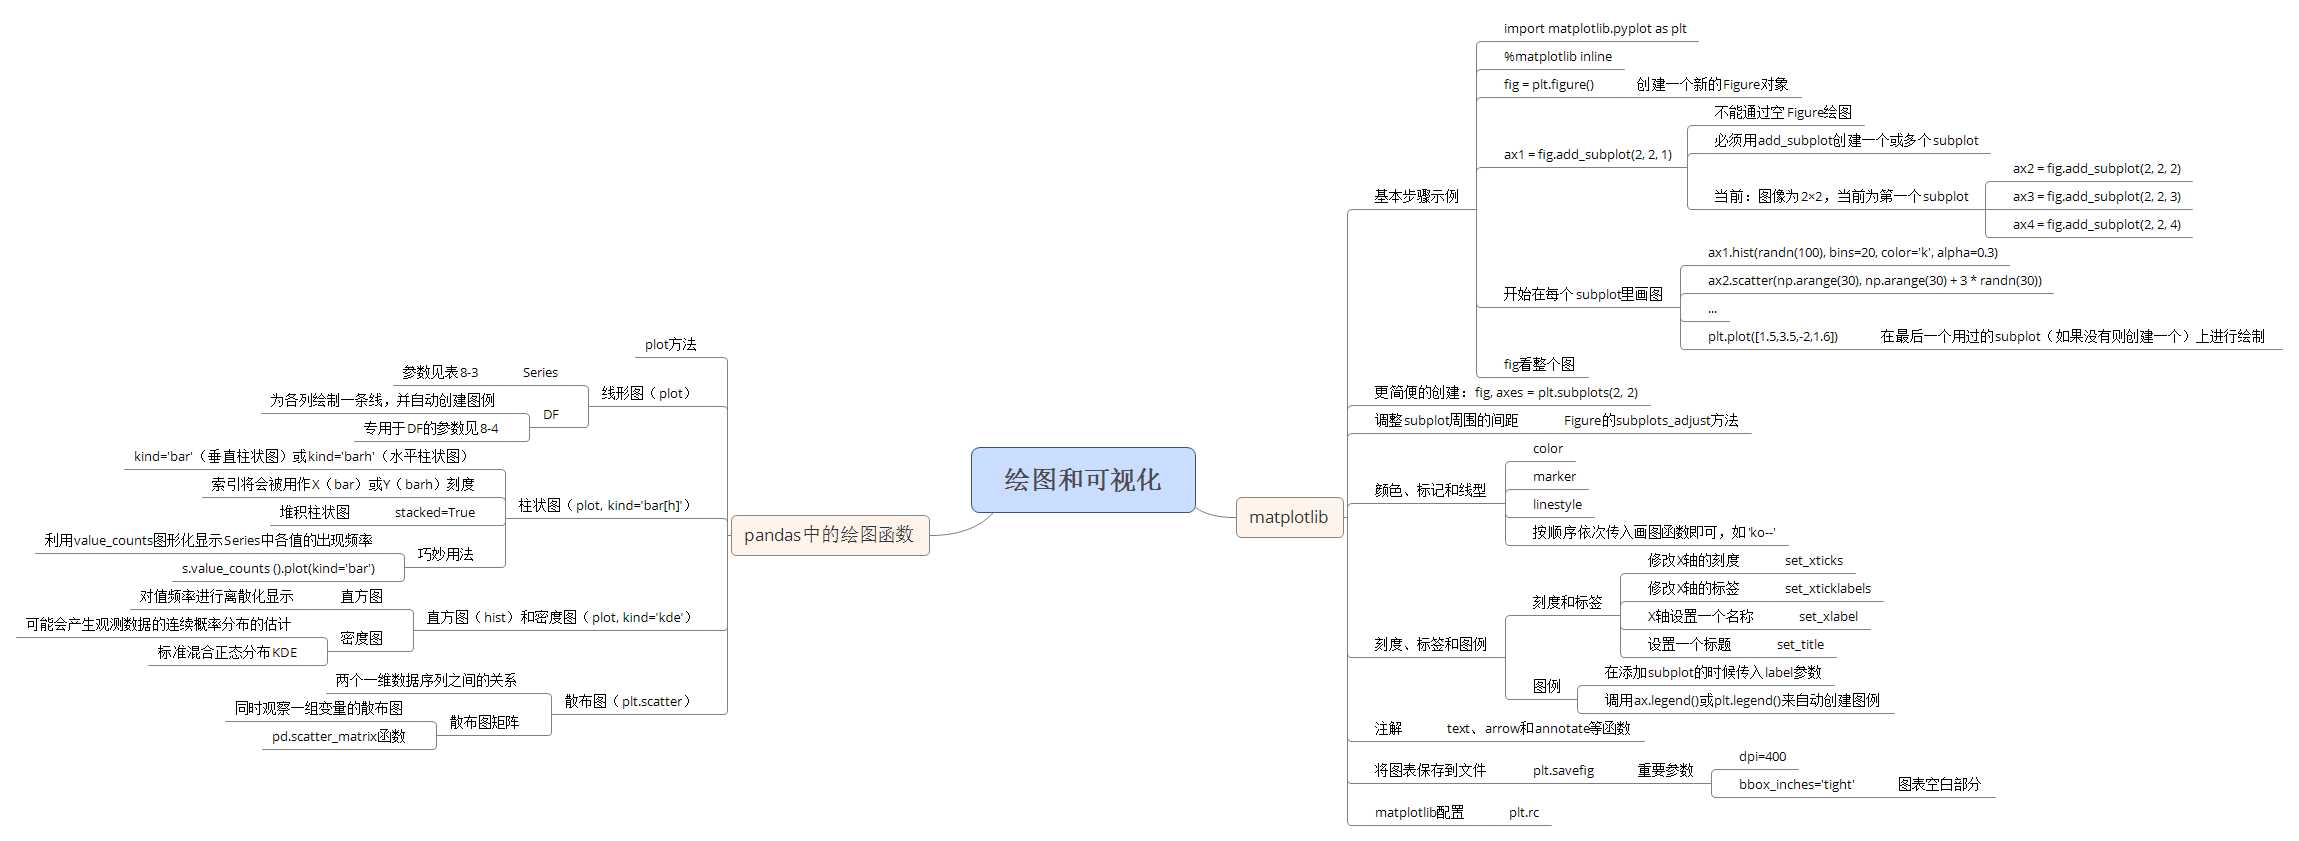
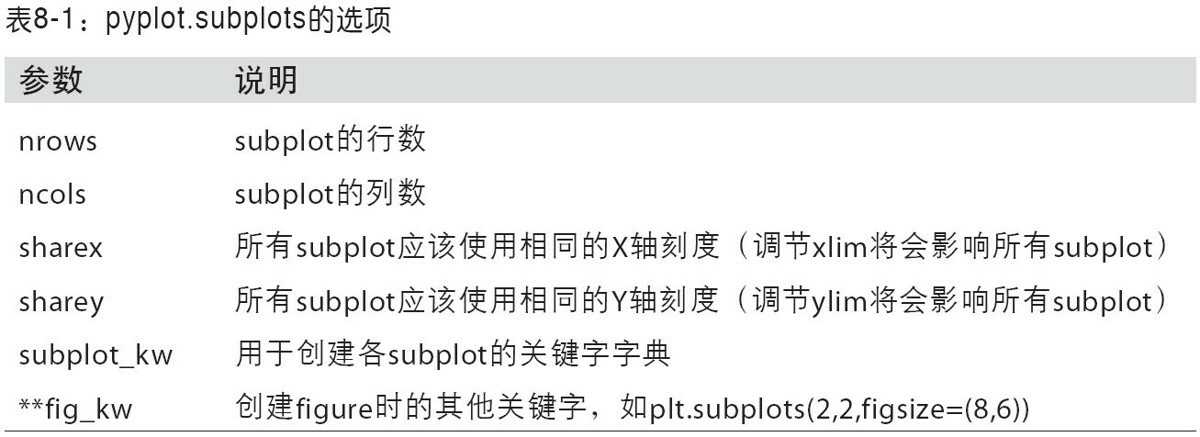
import matplotlib.pyplot as plt%matplotlib inlinefrom numpy.random import randnimport numpy as np# 一种方法fig = plt.figure()ax1 = fig.add_subplot(2, 2, 1)ax2 = fig.add_subplot(2, 2, 2)ax3 = fig.add_subplot(2, 2, 3)ax4 = fig.add_subplot(2, 2, 4)plt.plot([1.5,3.5,-2,1.6]) # 在最后一个用过的subplot(如果没有则创建一个)上进行绘制ax1.hist(randn(100), bins=20, color=‘k‘, alpha=0.3)ax2.plot(randn(50).cumsum(), ‘k--‘)ax3.scatter(np.arange(30), np.arange(30) + 3 * randn(30))fig# 更简便的添加subplot的方法fig, axes = plt.subplots(2, 2, sharex=True, sharey=True)for i in range(2):for j in range(2):axes[i, j].hist(randn(500), bins=50, color=‘k‘, alpha=0.5)

标签:
原文地址:http://www.cnblogs.com/woaielf/p/5808980.html