标签:
HMobj = HeatMap(alldata,‘RowLabels‘,{‘JB1‘,‘JB2‘,‘JB3‘,‘JB4‘,‘JB5‘,‘JB6‘,‘JB7‘,‘JB8‘,‘JB9‘})
alldata is a 9*253 matrix. Data range is [0 680].
如何修改colorbar 显示的范围呢?
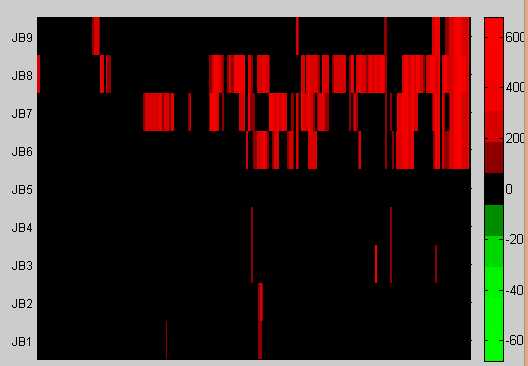
construct a heatmap with matrix by HeatMap
标签:
原文地址:http://www.cnblogs.com/Sophie2016-Bio/p/5892071.html