标签:recommend requests complete monitor request director expec line ret
转载自工作伙伴Garrett, Helen “SQL Server Performance Counter captures”
The following counters are the recommended list to capture baseline performance metrics for SQL Server:
Microsoft provides a command line utility “TypePerf” which allows capturing counters from a remote system to a monitoring system and logging these either to the command window or a log file.
More information about the TypePerf command can be found at:
https://www.microsoft.com/resources/documentation/windows/xp/all/proddocs/en-us/nt_command_typeperf.mspx?mfr=true
Create a folder on the monitoring server named “TypePerf”.
Create a new file in the TypePerf folder named TypePerf_SQLCounters.txt.
Edit the TypePerf_SQLCounters.txt file by copying the following contents into the file:
\\SERVERNAME\Memory\Available Bytes
\\SERVERNAME\Memory\Page Reads/sec
\\SERVERNAME\Memory\Page Writes/sec
\\SERVERNAME\Paging File(_Total)\% Usage
\\SERVERNAME\PhysicalDisk(_Total)\% Disk Time
\\SERVERNAME\PhysicalDisk(_Total)\Avg. Disk Queue Length
\\SERVERNAME\PhysicalDisk(_Total)\Avg. Disk sec/Read
\\SERVERNAME\PhysicalDisk(_Total)\Avg. Disk sec/Transfer
\\SERVERNAME\PhysicalDisk(_Total)\Avg. Disk sec/Write
\\SERVERNAME\Processor(_Total)\% Privileged Time
\\SERVERNAME\Processor(_Total)\% Processor Time
\\SERVERNAME\Processor(_Total)\% User Time
\\SERVERNAME\SQLServer:Access Methods\Page Splits/sec
\\SERVERNAME\SQLServer:Buffer Manager\Buffer cache hit ratio
\\SERVERNAME\SQLServer:Buffer Manager\Page life expectancy
\\SERVERNAME\SQLServer:Buffer Manager\Page lookups/sec
\\SERVERNAME\SQLServer:General Statistics\User Connections
\\SERVERNAME\SQLServer:Memory Manager\Memory Grants Pending
\\SERVERNAME\SQLServer:SQL Statistics\Batch Requests/sec
\\SERVERNAME\SQLServer:SQL Statistics\SQL Compilations/sec
\\SERVERNAME\SQLServer:SQL Statistics\SQL Re-Compilations/sec
\\SERVERNAME\SQLServer:Wait Statistics(*)\Memory grant queue waits
\\SERVERNAME\SQLServer:Wait Statistics(*)\Network IO waits
\\SERVERNAME\SQLServer:Wait Statistics(*)\Page IO latch waits
\\SERVERNAME\SQLServer:Wait Statistics(*)\Page latch waits
\\SERVERNAME\System\Processor Queue Length
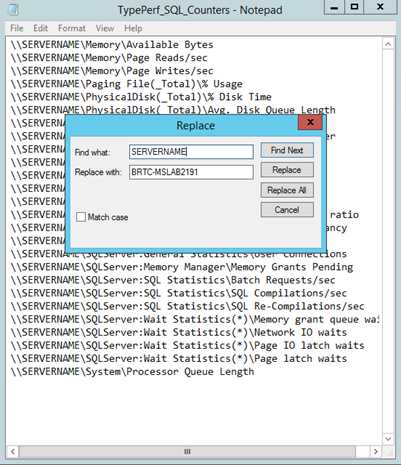
Perform a global replace of the SERVERNAME to match the actual server name for the SQL Server that is to be monitored. Save the file and Close.
--------------------------------------------------------------分割线---------------------------------------------------------------------------
Go to the Start menu -> Command Prompt.
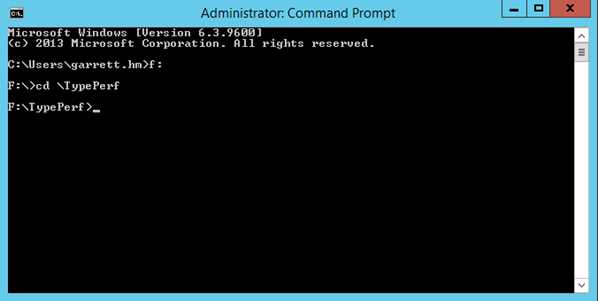
Change the directory to the location where the TypePerf directory was created.
At the command prompt, modify the next command to match the information for the SQL Server being monitored:
TYPEPERF -cf F:\TypePerf\TypePerf_SQLCounters.txt -f csv -o F:\TypePerf\MSLAB2191_yyyymmdd_hhmm.csv -s BRTC_MSLAB2191
-cf Name of the file that contains the list of counters to capture
-f format of the log file, defaults to csv
-o Path\name of output file
-s Name of server to collect the counters from if one does not exist in the counter file
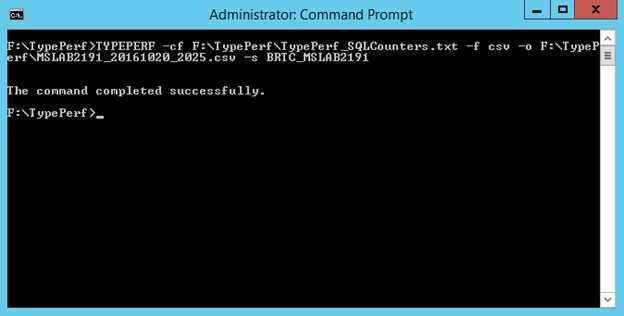
EXAMPLE:
TYPEPERF -cf F:\TypePerf\TypePerf_SQLCounters.txt -f csv -o F:\TypePerf\MSLAB2191_20161020_2025.csv -s BRTC_MSLAB2191
Press Enter to start the counter collection…
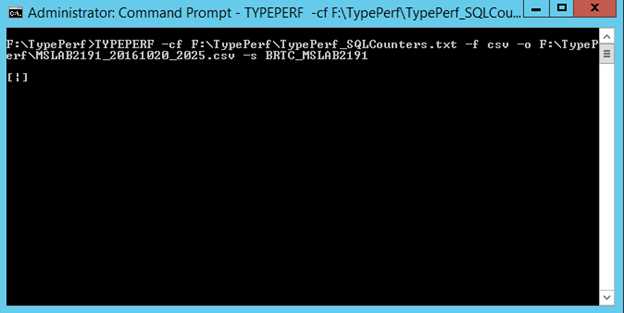
The [\] will run the command and capture the counters every second.
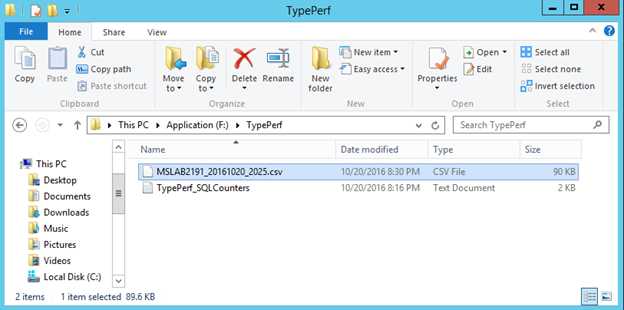
Verify the file you specified for the output was created and is growing:
-------------------------------------------------------分割线-----------------------------------------------------------------------
When you have completed the SQL Server test, Press CTRL-C to stop the counter collection.
Close the Command Prompt window.
怎样获取Windows平台下SQL server性能计数器值
标签:recommend requests complete monitor request director expec line ret
原文地址:http://www.cnblogs.com/Jadie/p/6117202.html