标签:gen 改变 using 其他 ota exp nes 特殊字符 als
一, 关于color:
http://matplotlib.org/api/colors_api.html#module-matplotlib.colors
1, 直接输入颜色名称
b: blueg: greenr: redc: cyanm: magentay: yellowk: blackw: whitecolor = ‘cyan‘
color = ‘magenta‘
2, gray
color = ‘0.95‘
color = ‘0.75‘
color = ‘0.55‘
3, 用RGB tuple (r,g,b)来表示颜色, range~[0,1]
color = (0,0,0)黑色
color = (1,1,1)白色
color = (0.5,0.8,0.5)偏绿
color = (0.5,0.5,0.8)偏蓝
color = (0.8,0.5,0.5)偏红
4, color bar
http://matplotlib.org/api/colorbar_api.html
二, 数学表达式 mathematical expressions, 用Tex markup.
http://matplotlib.org/users/mathtext.html
将表达式放到: r‘$...$‘ 内部
例:
1, 特殊字符:
\lambda, \pi, \rho, \sigma, \theta, \Delta, \Pi, \sum, \lg, \ln, \log,
r‘$\alpha > \beta$‘
2, subscripts and superscripts 上标(^)和下标(_)
r‘$\alpha_i > \beta_i$‘
r‘$\sum_{i=0}^\infty x_i$‘
3, fraction分数
r‘$\left(\frac{5 - \frac{1}{x}}{4}\right)$‘
4, 字体默认为italics. 改变字体用font command
r‘$s(t) = \mathcal{A}\mathrm{sin}(2 \omega t)$‘ (A为罗马, sin也为罗马)
\mathrm{Roman}
\mathit{Italic}
\mathtt{Typewriter}
三, text
1, matplotlib.pyplot.text(x, y, s, fontdict=None, withdash=False, **kwargs)
说明:
x,y 文字坐标。
s 文字内容。(label= ‘...‘ 或者 text=‘...‘)
fontdict修饰文字的字典,
fontdict修饰文字的字典,常用的有:
文字大小: fontsize = 12
fontstyle = ‘normal‘,‘italic‘,‘oblique‘
fontweight = [a numeric value in range 0-1000 | ‘ultralight’ | ‘light’ | ‘normal’ | ‘regular’ | ‘book’ | ‘medium’ | ‘roman’ | ‘semibold’ | ‘demibold’ | ‘demi’ | ‘bold’ | ‘heavy’ | ‘extra bold’ | ‘black’ ]
透明度: alpha = 0.8
Put a rectangular box around the text: bbox=dict(facecolor=‘red‘, alpha=0.5))
2, Axes.set_xlabel(xlabel, fontdict=None, labelpad=None, **kwargs)
xlabel: 文字内容
fontdict 和 plt.text中的字典通用
labelpad 定义文字到坐标轴的距离。spacing in points between the label and the x-axis
3, Axes.set_ylabel(ylabel, fontdict=None, labelpad=None, **kwargs)
ylabel: 文字内容
其他和set_xlable一样
4, Axes.set_title(label, fontdict=None, loc=‘center‘, **kwargs)
label: title name
fontdict 默认值:{‘fontsize‘: rcParams[‘axes.titlesize‘], ‘fontweight‘ : rcParams[‘axes.titleweight‘], ‘verticalalignment‘: ‘baseline‘, ‘horizontalalignment‘: loc}
loc : {‘center’, ‘left’, ‘right’}, str, optional Which title to set, defaults to ‘center’
5, Axes.annotate(*args, **kwargs)
Annotate the point xy with text s. Additional kwargs are passed to Text.
s: 文字内容
xy=(x,y) 注释的坐标
xytext = (x,y) 文字坐标
arrowprops=dict(arrowsytyle=‘->‘) 定义在xy 和 xytext 之间的箭头。
详见 http://matplotlib.org/api/pyplot_api.html#matplotlib.pyplot.annotate
Example:
import matplotlib.pyplot as plt
fig = plt.figure()
ax = fig.add_subplot(111)
ax.set_title(‘axes title‘)
ax.set_xlabel(‘xlabel‘)
ax.set_ylabel(‘ylabel‘)
ax.text(3, 8, ‘boxed italics text in data coords‘, style=‘italic‘,
ax.text(2, 6, r‘an equation: $E=mc^2$‘, fontsize=15)
ax.text(0.95, 0.01, ‘colored text in axes coords‘,verticalalignment=‘bottom‘, horizontalalignment=‘right‘,color=‘green‘, fontsize=15)
ax.plot([2], [1], ‘o‘)
ax.annotate(‘annotate‘, xy=(2, 1), xytext=(3, 4),
ax.axis([0, 10, 0, 10])
plt.show()
四, maker和line
1, 线图和点图
Axes.plot(*args, **kwargs)
plot(x, y) # plot x and y using default line style and color
plot([1,2,3], [1,2,3], ‘go-‘, label=‘line 1‘, linewidth=2)
plot(x, y, color=‘green‘, linestyle=‘dashed‘, marker=‘o‘, markerfacecolor=‘blue‘, markersize=12)
alpha 透明度 0-1
animated = True
color=
label =
linestyle = [‘solid’ | ‘dashed’, ‘dashdot’, ‘dotted’ | (offset, on-off-dash-seq) | ‘-‘ | ‘--‘ | ‘-.‘ | ‘:‘ | ‘None‘ | ‘ ‘ | ‘‘]
linewidth =
marker = http://matplotlib.org/api/markers_api.html#module-matplotlib.markers
markeredgecolor=
markeredgewidth=
markerfacecolor=
markersize=
2, 散点图
Axes.scatter(x, y, s=None, c=None, marker=None, cmap=None, norm=None, vmin=None, vmax=None, alpha=None, linewidths=None, verts=None, edgecolors=None, **kwargs)
Make a scatter plot of x vs y
s: marker size 可以是array like
c: marker color 可以是array like
marker: http://matplotlib.org/api/markers_api.html#matplotlib.markers.MarkerStyle
alpha 透明度
edgecolors
Example(copy from offical website):
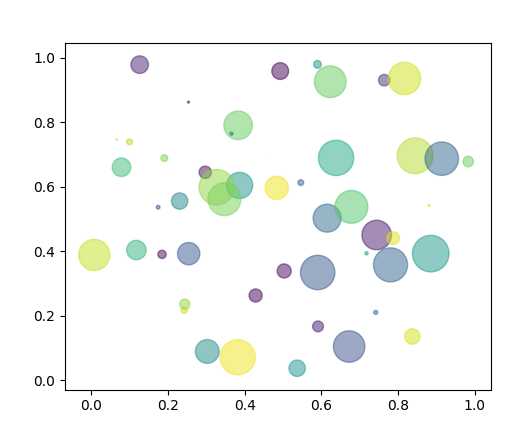
"""
Simple demo of a scatter plot.
"""
import numpy as np
import matplotlib.pyplot as plt
N = 50
x = np.random.rand(N)
y = np.random.rand(N)
colors = np.random.rand(N)
area = np.pi * (15 * np.random.rand(N))**2 # 0 to 15 point radii
plt.scatter(x, y, s=area, c=colors, alpha=0.5)
plt.show()
UNL
Chenyong
cmiao@huskers.unl.edu
标签:gen 改变 using 其他 ota exp nes 特殊字符 als
原文地址:http://www.cnblogs.com/freemao/p/6392328.html