标签:情况 statistic www stack xxxx 无法 logs 故障 points
sga区叫共享全局区(系统共享区)很多个进程都可以访问。
使用锁来解决共享资源的并发问题。锁一般是个内存结构。
提到锁来回顾一下latch锁。latch是个内存结构。
要修改数据就要持有latch。
latch和mutex
1、如果无法持有latch,不退出cpu,随机的等待,再次尝试持有(在这期间可能其他进程抢先持有,没有排队),多次无法持有将释放cpu。
详细内容请见前面解析8。
1、前一个进程latch释放
2、本进程ping住buffer,修改数据。修改完成释放ping。
3、没有提交。见前面的。undo。
oracle数据库中,dml加的是行锁而不是块锁,ping住是修改的瞬间。数据不提交,行锁一直不释放。粒度很小。产生冲突的可能性很小。
oracle数据库也可能加表锁。
1、修改一个行,就加了一个行锁tm:rx锁。
2、要删除drop 一个表。就在表上加 tm:x锁。
sp1修改了一个表中的行在一个表上加 tm :rx锁,未提交。sp2 要drop 掉了这个表,要在tm:x ,sp2就加不上锁。
表锁的关系。
tm:rx 和tm:x冲突。
tm:rx和tm:rx是不冲突。
tm:x和tm:x冲突。
for update表上是tm:rs 行上是rx锁。
dml不阻塞select。
事务锁有事务等待引起的排队,
锁的排队机制。
持有者,转换者队列。
oracle锁
tx
tm
查看
select * from v$lock_type a where a.TYPE in (‘TM‘,‘TX‘);
有两个参数。

1、客户端1开始一个事务。
SQL> delete from t1;1 row deleted.SQL>
2、会话2访问t1表
SQL> delete from t1;
3、会话3删除t1
SQL> delete from t1;
从v$lock视图中查询类型为TM和TX的锁。
select * from v$lock l where l.type in (‘TM‘,‘TX‘);
结果
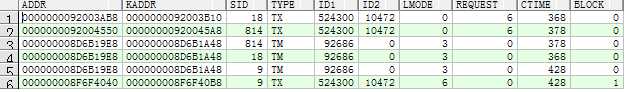
select * from v$lock l where l.type in (‘TM‘,‘TX‘) order by sid; —对结果排序。
sid会话号。LMODE持有类型。CTIME持有时间。
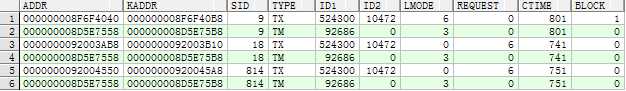
查询是在哪个对象上持有的。
select * from dba_objects o where o.object_id=92686;

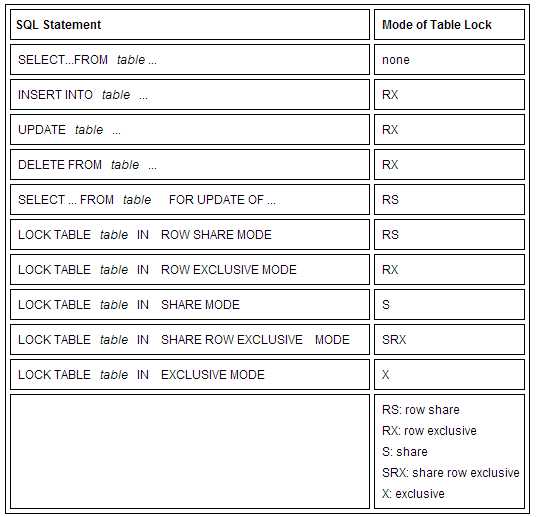
持有模式LMODE类型参考下图。
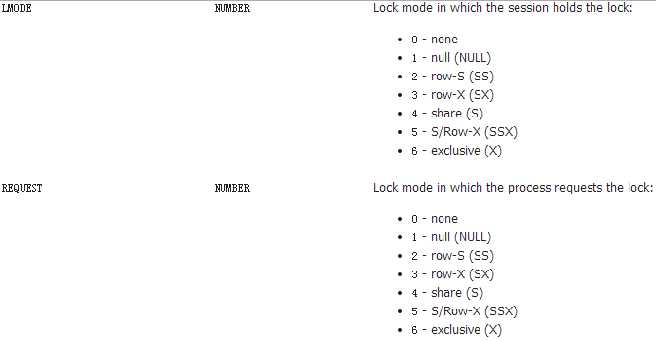
LMODE为6表示以x方式持有表。(被这个事务所阻塞。)
事务xid有三部分组成,段号,事务表槽位号,第几次被覆盖。
| 段号,事务表槽位号 | 第几次被覆盖 |
|---|---|
| ID1 | ID2 |
说明sid为9、18、814的会话,都被 ID1:524300 和 ID2:10472所决定的事务所阻塞了。
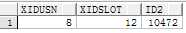
根据ID1计算出事务。
SELECT trunc(t1.ID1 / power(2, 16)) XIDUSN,bitand(t1.id1, to_number(‘ffff‘, ‘xxxx‘)) XIDSLOT,t1.id2FROM v$lock t1WHERE t1.BLOCK > 0
SELECT trunc(524300 / power(2, 16)) XIDUSN,bitand(524300 , to_number(‘ffff‘, ‘xxxx‘)) XIDSLOT,t1.id2FROM v$lock t1WHERE t1.BLOCK > 0
查询结果(这个sql执行相当慢)
查询事务
select * from v$transaction;
查询结果


根据SES_ADDR查找,事务所对应的会话。
select * from v$session s where s.saddr=‘000000009358A220‘;
可以看到会话sid=9

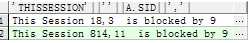
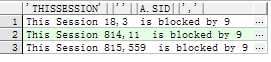
可以用另一种方式来查看谁被谁阻塞了。
select ‘This Session‘ || ‘ ‘ || a.sid || ‘,‘ || a.serial# ||‘ is blocked by ‘ || a.BLOCKING_SESSIONfrom v$session awhere a.BLOCKING_SESSION is not null;
结果
oracle数据库的锁
1、TX
2、TM
修改一个数据行,在数据行上加上了一个行锁
另外一个会话想修改相同的行的时候,被锁住,表现为
1号会话所对应的事务锁住了2号会话所对应的事务
TX锁
我们在一个表的一个数据行上加了一个行锁,那么Oracle在这个表上加上一个RX锁(TM)
修改行,加行锁,会在表上加表锁。
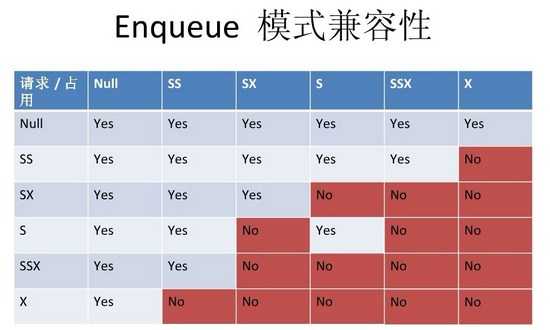
rx和rx是相互兼容的。
1、TX(作用在行上)
只有排他锁,是互斥的,条件是修改相同的数据行。
2、TM(作用在表上)
| 表上操作类型 | 表上锁类型 |
|---|---|
| insert 、delete、update | SX锁 |
| for update | SS(RS)锁 |
| ddl | X锁 |
| create index | s锁 |
lock table手动加锁。
首先在三个会话上执行回滚操作。
1、在会话1上插入操作。
SQL> rollback;Rollback complete.SQL> select sid from v$mystat where rownum=1;SID----------9SQL> desc t1;Name Null? Type----------------------------------------- -------- ----------------------------ID NUMBERNAME VARCHAR2(20)SQL> insert into t1 values(3,‘11‘);1 row created.SQL>
–查询表锁
select * from v$lock where type=‘TM‘;

看到sid为会话1,根据id1:92686 知道是表t1(刚才查过了),根据LMODE是3可以知道是sx锁。
2、在会话2上执行for update
SQL> select sid from v$mystat where rownum=1;SID----------814SQL> select * from t1;ID NAME---------- --------------------2 zyrSQL> select * from t1 where ID=2 for update;ID NAME---------- --------------------2 zyrSQL>
我们知道访问一个表使用for update会在一个表上加ss锁。
我们查看一下。
–查询表锁
select * from v$lock where type=‘TM‘;

可以看到LMODE是3查看LMODE表可以看到是SX锁,和预想的不太一样,实际上SS和SX是一样的,都是在行上加锁。
3、在会话3上执行删除表。可以看到资源正忙,因为这个表正在被其他会话修改。
SQL> drop table t1;drop table t1*ERROR at line 1:ORA-00054: resource busy and acquire with NOWAIT specified or timeout expiredSQL>
注意11g新特性。可以设置超时时间。
查询参数SQL> show parameter timeNAME TYPE VALUEawr_snapshot_time_offset integer 0control_file_record_keep_time integer 7cursor_space_for_time boolean FALSEddl_lock_timeout integer 0设置会话超时时间为100秒SQL> alter session set ddl_lock_timeout=100;Session altered.SQL>
再次执行删除表t1的操作。
SQL> drop table t1;
–查询表锁
select * from v$lock where type=‘TM‘;

可以看到sid 会话id为18的会话,LMODE为6,查看锁类型为x。
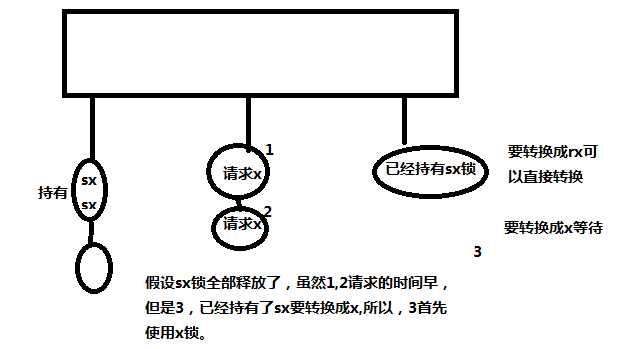
使用会话4,手动的加rx锁。
SQL> lock table t1 in row exclusive mode;Table(s) Locked.SQL>
使用会话5手动申请x锁。
SQL> lock table t1 in exclusive mode;
会话4转换锁
SQL> lock table t1 in row exclusive mode;Table(s) Locked.SQL> lock table t1 in exclusive mode;Table(s) Locked.SQL>
释放会话1、2、3的锁,可以看到会话4首先占用了x锁。
1、会话占用同一个资源,无法获取到资源。
2、少数会话将一个会话夯住了,
解决夯住的办法是
hang
1、都在等待一个资源
2、被另一个会话锁住。
解决办法。
1、sqlplus登陆,查询
2、hanganalyze、sysstate dump
模拟一个系统夯住的情况。
四个会话都执行删除t1表。
delete from t1;
查看谁被谁阻塞了。
select ‘This Session‘ || ‘ ‘ || a.sid || ‘,‘ || a.serial# ||‘ is blocked by ‘ || a.BLOCKING_SESSIONfrom v$session awhere a.BLOCKING_SESSION is not null;
结果是
查询会话sid 为 9的会话进程
select spid from v$process a,v$session b where a.addr=b.paddr and b.sid=9;
结构是

杀掉进程号为 2894的进程
[root@oracle ~]# ps -ef |grep 2894oracle 2894 2826 0 14:26 ? 00:00:02 oracleoracl (DESCRIPTION=(LOCAL=YES)(ADDRESS=(PROTOCOL=beq)))root 5114 5057 0 19:32 pts/4 00:00:00 grep 2894[root@oracle ~]# kill -9 2894[root@oracle ~]#
1、SQL> oradebug help
HELP [command] Describe one or all commandsSETMYPID Debug current processSETOSPID <ospid> Set OS pid of process to debugSETORAPID <orapid> [‘force‘] Set Oracle pid of process to debugSETORAPNAME <orapname> Set Oracle process name to debugSHORT_STACK Get abridged OS stackCURRENT_SQL Get current SQLDUMP <dump_name> <lvl> [addr] Invoke named dumpPDUMP [interval=<interval>] Invoke named dump periodically[ndumps=<count>] <dump_name> <lvl> [addr]DUMPSGA [bytes] Dump fixed SGADUMPLIST Print a list of available dumpsEVENT <text> Set trace event in processSESSION_EVENT <text> Set trace event in sessionDUMPVAR <p|s|uga> <name> [level] Print/dump a fixed PGA/SGA/UGA variableDUMPTYPE <address> <type> <count> Print/dump an address with type infoSETVAR <p|s|uga> <name> <value> Modify a fixed PGA/SGA/UGA variablePEEK <addr> <len> [level] Print/Dump memoryPOKE <addr> <len> <value> Modify memoryWAKEUP <orapid> Wake up Oracle processSUSPEND Suspend executionRESUME Resume executionFLUSH Flush pending writes to trace fileCLOSE_TRACE Close trace fileTRACEFILE_NAME Get name of trace fileSETTRACEFILEID <identifier name> Set tracefile identifierLKDEBUG Invoke global enqueue service debuggerNSDBX Invoke CGS name-service debugger-G <Inst-List | def | all> Parallel oradebug command prefix-R <Inst-List | def | all> Parallel oradebug prefix (return outputSETINST <instance# .. | all> Set instance list in double quotesSGATOFILE <SGA dump dir> Dump SGA to file; dirname in double quotesDMPCOWSGA <SGA dump dir> Dump & map SGA as COW; dirname in double quotesMAPCOWSGA <SGA dump dir> Map SGA as COW; dirname in double quotesHANGANALYZE [level] [syslevel] Analyze system hangFFBEGIN Flash Freeze the InstanceFFDEREGISTER FF deregister instance from clusterFFTERMINST Call exit and terminate instanceFFRESUMEINST Resume the flash frozen instanceFFSTATUS Flash freeze status of instanceSKDSTTPCS <ifname> <ofname> Helps translate PCs to namesWATCH <address> <len> <self|exist|all|target> Watch a region of memoryDELETE <local|global|target> watchpoint <id> Delete a watchpointSHOW <local|global|target> watchpoints Show watchpointsDIRECT_ACCESS <set/enable/disable command | select query> Fixed table accessIPC Dump ipc informationUNLIMIT Unlimit the size of the trace fileCALL [-t count] <func> [arg1]...[argn] Invoke function with argumentsCORE Dump core without crashing processPROCSTAT Dump process statisticsSQL>
2、oradebug setmypid用当前会话登陆做数据分析。
SQL> oradebug setmypidStatement processed.SQL>
3、oradebug unlimit 不限制文件的大小。
SQL> oradebug unlimitStatement processed.SQL>
查看dumplist
4、用级别3 oradebug dump hanganalyze 3
SQL> oradebug dump hanganalyze 3Statement processed.SQL>
5、文件地址
SQL> oradebug tracefile_name/u01/app/oracle/diag/rdbms/oracl/oracl/trace/oracl_ora_3039.trcSQL>
6、退出查看文件
我们知道当一个数据库hang住时,最头痛的问题是无法登陆数据,也就无法进行故障的处理,因此很多人只能通过重启
操作系统来讲解决问题,其实从Oracle 10g开始,Oracle提供了prelim的登陆方式,如下:
sqlplus -prelim / as sysdbaoradebug setospid <process ID>oradebug unlimitoradebug dump systemstate 10
其他方法同上一个。
[root@oracle ~]# ps -ef |grep LOCALoracle 2989 2988 0 14:27 ? 00:00:01 oracleoracl (DESCRIPTION=(LOCAL=YES)(ADDRESS=(PROTOCOL=beq)))oracle 4196 4195 0 17:19 ? 00:00:00 oracleoracl (DESCRIPTION=(LOCAL=YES)(ADDRESS=(PROTOCOL=beq)))root 5455 5057 0 20:19 pts/4 00:00:00 grep LOCAL
[root@oracle usr]# cd /usr/bin[root@oracle bin]# ls gdbgdb[root@oracle bin]#[root@oracle bin]# chmod +s gdb[root@oracle bin]# ll gdb-rwsr-sr-x 1 root root 4493600 Apr 24 2013 gdb[root@oracle bin]#[oracle@oracle ~]$ gdb $ORACLE_HOME/bin/oracle 2989 ---用2989会话gdb) print ksudss(10) ---开始$1 = 0(gdb) detach --结束Detaching from program: /u01/app/oracle/product/11.2.0/db_1/bin/oracle, process 2989(gdb)
用另一个窗口。查看文件。
[oracle@oracle ~]$ cd $LOG[oracle@oracle trace]$ ll -t|moretotal 2072-rw-r----- 1 oracle oinstall 9535 Feb 15 20:24 oracl_mmon_2860.trc-rw-r----- 1 oracle oinstall 943 Feb 15 20:24 oracl_mmon_2860.trm-rw-r----- 1 oracle oinstall 890164 Feb 15 20:24 oracl_ora_2989.trc-rw-r----- 1 oracle oinstall 95905 Feb 15 20:24 oracl_ora_2989.trm-rw-r----- 1 oracle oinstall 319205 Feb 15 20:24 alert_oracl.log-rw-r----- 1 oracle oinstall 20159 Feb 15 19:51 oracl_ora_3039.trc-rw-r----- 1 oracle oinstall 2304 Feb 15 19:51 oracl_ora_3039.trm-rw-r----- 1 oracle oinstall 952 Feb 15 19:00 oracl_j001_4837.trc-rw-r----- 1 oracle oinstall 69 Feb 15 19:00 oracl_j001_4837.trm[oracle@oracle trace]$ vi oracl_ora_2989.trc[oracle@oracle trace]$ 发现很难看懂用工具格式化一下。将文件复制到[oracle@oracle trace]$ pwd/u01/app/oracle/diag/rdbms/oracl/oracl/trace[oracle@oracle trace]$ ls ass109.awkass109.awk[oracle@oracle trace]$[oracle@oracle trace]$ awk -f ass109.awk oracl_ora_2989.trc--进行格式化
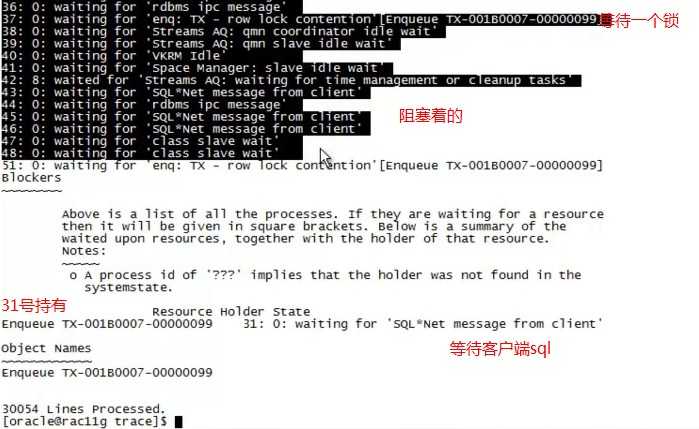
40: 0: waiting for ‘Streams AQ: qmn slave idle wait‘41: 9: waited for ‘Streams AQ: waiting for time management or cleanup tasks‘42: 0: waiting for ‘SQL*Net message from client‘44: 0: waiting for ‘rdbms ipc message‘45: 0: waiting for ‘rdbms ipc message‘47: 0: waiting for ‘enq: TX - row lock contention‘[Enqueue TX-00080011-000028F5]Blockers~~~~~~~~Above is a list of all the processes. If they are waiting for a resourcethen it will be given in square brackets. Below is a summary of thewaited upon resources, together with the holder of that resource.Notes:~~~~~o A process id of ‘???‘ implies that the holder was not found in thesystemstate.Resource Holder StateEnqueue TX-00080011-000028F5 42: 0: waiting for ‘SQL*Net message from client‘---42号持有这个事务Object Names~~~~~~~~~~~~Enqueue TX-00080011-000028F533961 Lines Processed.[oracle@oracle trace]$
[oracle@oracle trace]$ vi oracl_ora_2989.trcPROCESS 42:----------------------------------------SO: 0x94711480, type: 2, owner: (nil), flag: INIT/-/-/0x00 if: 0x3 c: 0x3proc=0x94711480, name=process, file=ksu.h LINE:12721, pg=0(process) Oracle pid:42, ser:2, calls cur/top: (nil)/0x70dde2c8flags : (0x0) -flags2: (0x1000), flags3: (0x10)intr error: 0, call error: 0, sess error: 0, txn error 0intr queue: emptyksudlp FALSE at location: 0(post info) last post received: 0 0 9last post received-location: ksq.h LINE:2015 ID:ksqrcllast process to post me: 0x94712538 13 0last post sent: 0 0 9last post sent-location: ksq.h LINE:2015 ID:ksqrcllast process posted by me: 0x94716818 32 0(latch info) wait_event=0 bits=0x0Process Group: DEFAULT, pseudo proc: 0x943696a8O/S info: user: oracle, term: UNKNOWN, ospid: 2989OSD pid info: Unix process pid: 2989, image: oracle@oracle (TNS V1-V3)/pid:42---查找pid为42的操作系统的pid
查看操作系统是否有这个2989的进程呢。
[oracle@oracle trace]$ ps -ef |grep 2989oracle 2989 2988 0 14:27 ? 00:00:01 oracleoracl (DESCRIPTION=(LOCAL=YES)(ADDRESS=(PROTOCOL=beq)))root 5788 5479 0 20:46 pts/4 00:00:01 gdb /u01/app/oracle/product/11.2.0/db_1/bin/oracle 2989oracle 5873 5564 0 20:59 pts/5 00:00:00 grep 2989[oracle@oracle trace]$
select spid from v$process a,v$session b where a.addr=b.paddr and b.sid=42;
标签:情况 statistic www stack xxxx 无法 logs 故障 points
原文地址:http://www.cnblogs.com/haitianjingyu/p/6415009.html