标签:result 保存 line gdi import size images 添加 except
import tensorflow as tf
import numpy as np
import matplotlib.pyplot as plt #python的结果可视化模块
"""定义一个添加神经层的函数
inputs:输入数据
in_size:输入神经元的个数
out_size:输出神经元的个数
activation_function:激活函数
"""
def add_layer(inputs, in_size, out_size, n_layer, activation_function=None):
layer_name = ‘layer%s‘ % n_layer
with tf.name_scope(layer_name):
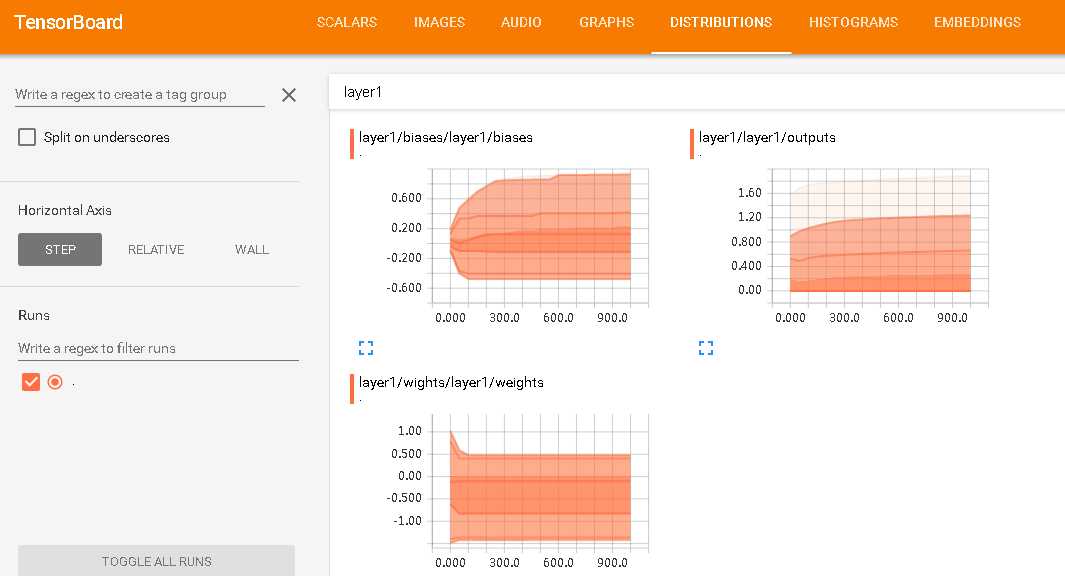
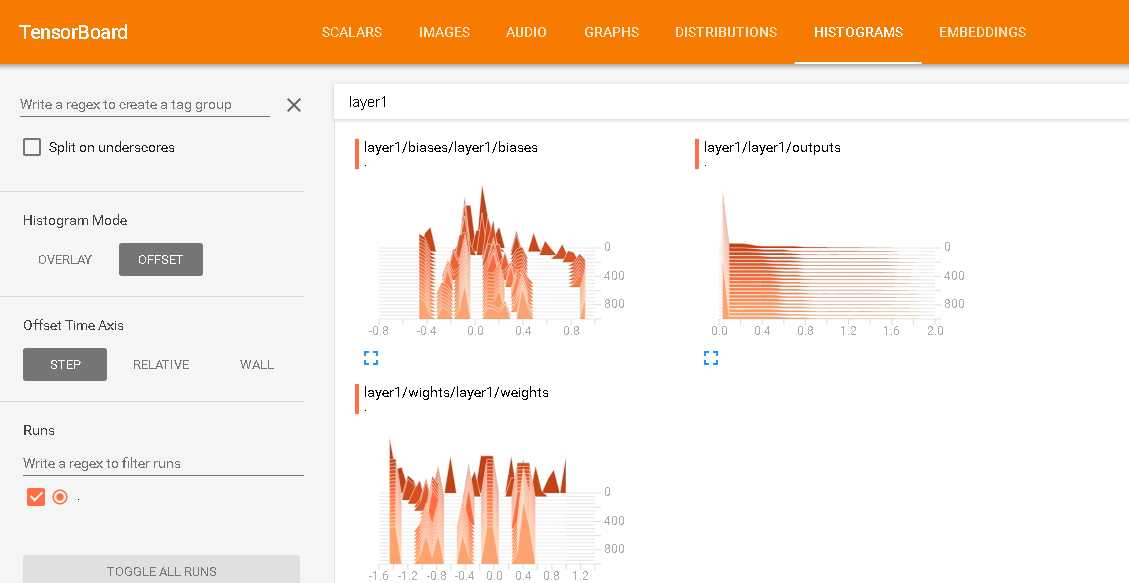
with tf.name_scope("wights"):
Weights = tf.Variable(tf.random_normal([in_size, out_size]), name=‘W‘) #定义权重矩阵
#tf.summary.histogram用于保存变量的变化
tf.summary.histogram(layer_name+‘/weights‘, Weights)
with tf.name_scope("biases"):
biases = tf.Variable(tf.zeros([1, out_size]) + 0.1, name=‘b‘)#定义偏置
tf.summary.histogram(layer_name + ‘/biases‘, biases)
with tf.name_scope("Wx_plus_b"):
Wx_plus_b = tf.matmul(inputs, Weights) + biases #预测出的值
if activation_function is None:
outputs = Wx_plus_b #线性激活
else:
outputs = activation_function(Wx_plus_b) #非线性激活
tf.summary.histogram(layer_name + ‘/outputs‘, outputs)
return outputs
"""创建数据"""
#定义输入,linspace产生等差数列,加上数据的维度,定义输入数据为300个例子
x_data = np.linspace(-1, 1, 300)[:, np.newaxis]
# print(x_data.shape)
noise = np.random.normal(0, 0.05, x_data.shape) #定义噪声点
y_data = np.square(x_data) - 0.5 + noise # y=x_data*x_data - 0.5
"""定义网络
输入层:1个神经元(使用输入的一个元素)
隐藏层:定义10个神经元
输出层:1个神经元(1个输入对应一个输出)
"""
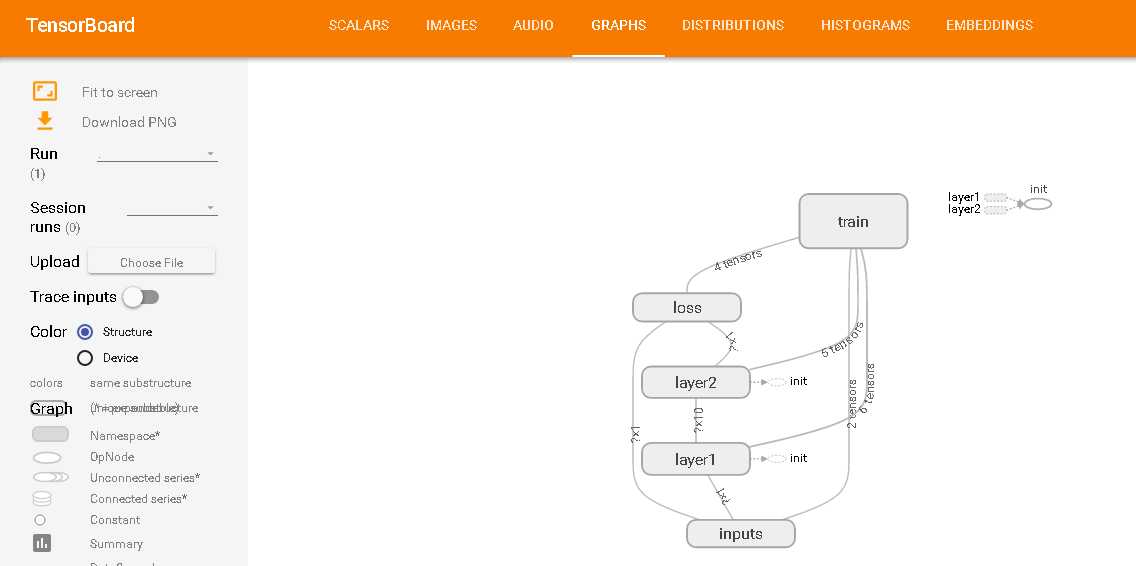
#定义命名空间,使用tensorboard进行可视化
with tf.name_scope("inputs"):
xs = tf.placeholder(tf.float32, [None, 1], name="x_input") #模型的输入x值
ys = tf.placeholder(tf.float32, [None, 1], name="y_input") #模型的输入y值
#隐藏层
l1 = add_layer(xs, 1, 10, n_layer=1, activation_function=tf.nn.relu)
#输出层
prediction = add_layer(l1, 10, 1, n_layer=2, activation_function=None)
#损失函数
with tf.name_scope("loss"):
loss = tf.reduce_mean(tf.reduce_sum(tf.square(ys-prediction),
reduction_indices=[1]))
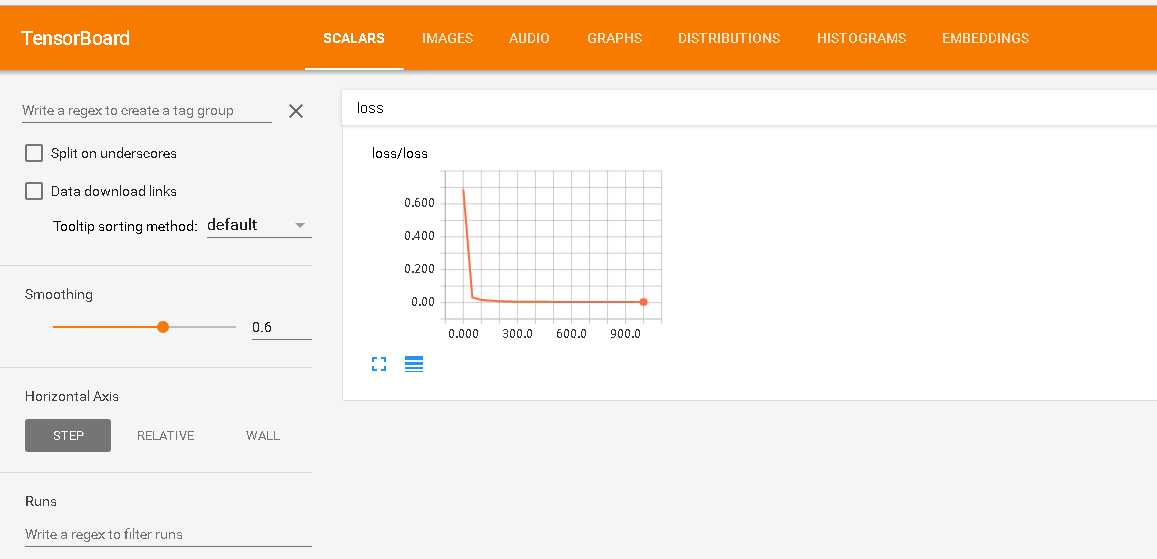
tf.summary.scalar(‘loss‘, loss) #用于观察常量的变化
#模型训练
with tf.name_scope("train"):
train_step = tf.train.GradientDescentOptimizer(0.1).minimize(loss)
init = tf.global_variables_initializer() #初始化所有变量
with tf.Session() as sess:
merged = tf.summary.merge_all()
writer = tf.summary.FileWriter("logs/", sess.graph) #保存神经网络的所有的信息,方便浏览器访问
sess.run(init)
for i in range(1001):
sess.run(train_step, feed_dict={xs: x_data, ys: y_data})
if i % 50 == 0:#每训练50次,合并一下结果
result = sess.run(merged, feed_dict={xs: x_data, ys: y_data})
writer.add_summary(result, i)
"""
fig = plt.figure() #定义一个图片框
ax = fig.add_subplot(1, 1, 1)
ax.scatter(x_data, y_data) #输出样本值
plt.ion() #防止plt后程序暂停
plt.show() #一次输出,将程序暂停
for i in range(1001):
sess.run(train_step, feed_dict={xs:x_data,ys:y_data})
if i % 50 == 0:
# print(i, sess.run(loss, feed_dict={xs:x_data,ys:y_data}))
try:
ax.lines.remove(lines[0]) # 去除lines的第一个线条
except Exception:
pass
prediction_value = sess.run(prediction, feed_dict={xs:x_data})
lines = ax.plot(x_data, prediction_value, ‘r-‘, lw=5) #将预测的值plot上去
plt.gca()
plt.pause(0.1) #每0.1秒输出一次
"""
使用tensorboard进行可视化
1、将需要可视化的操作保存在‘logs’文件夹下
2、cmd进入logs文件夹所在的父文件路径
3、tensorboard --logdir=logs
4、在浏览器中访问3中命令返回的ip地址
结果展示如下:
开始训练完模型后无法显示graph。解决方法:必须在lcmd中进入‘logs‘文件夹的父路径中,在键入tensorboard命令,尽量使用Chrom浏览器,其他的浏览器可能会遇到不兼容的问题。
Tensorflow搭建神经网络及使用Tensorboard进行可视化
标签:result 保存 line gdi import size images 添加 except
原文地址:http://www.cnblogs.com/studyDetail/p/6523010.html