标签:估计 nis learn adl 绘图 amp author logs machine
作业在这,http://speech.ee.ntu.edu.tw/~tlkagk/courses/ML_2016/Lecture/hw2.pdf 是区分spam的。
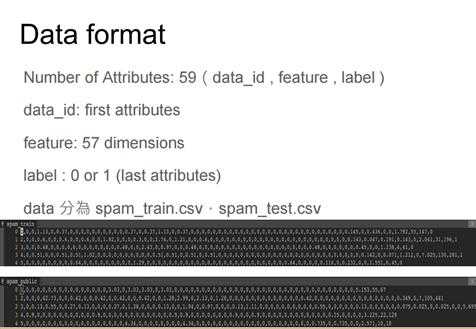
57维特征,2分类问题。采用逻辑回归方法。但是上述数据集在kaggle中没法下载,于是只能用替代的方法了,下了breast-cancer-wisconsin数据集。
链接在这http://archive.ics.uci.edu/ml/machine-learning-databases/breast-cancer-wisconsin/breast-cancer-wisconsin.data
9个特征,标签分别为2/4 第一个为序号,没有表头,一共699个数据,但有些数据有缺失? 采取丢弃
不说了,上代码,看看怎么弄。
第一步: 读取原始数据集,并去除数据缺失的数据,并将标签变为0/1

 1 # -*- coding: utf-8 -*-
 2 __author__ = ‘Administrator‘
 3
 4 import csv
 5 import cv2
 6 import sys
 7 import numpy as np
 8 import math
 9 import random
10
11 filename = ‘F:/台湾机器学习/data/2/data.csv‘
12 ufilename = unicode(filename , "utf8") #这一块主要是因为汉字路径 也就是python调用open打开文件时,其路径必须要转换为utf-8格式
13 list=[]
14 result=[]
15 row=0
16 colum=0;
17 with open(ufilename, ‘r‘) as f:
18     data = f.readlines()  #dat中所有字符串读入data
19     for line in data:
20         odom = line.split(‘,‘)        #将单个数据分隔开存好
21         colum=len(odom)
22         if ‘?‘in odom:
23             print(odom)
24         else:
25             lists= map(int, odom[1:11])#第一个开始开始数据  一直取10个数
26             if lists[9]==2:
27                 lists[9]=0
28             else:
29                 lists[9]=1
30             list.append(lists)
31             # print odom
32         row=row+1
33
34 print("原始数据是:{0}行 :{1}列 的数据".format(row, colum))
35 print("有{0}个训练数据".format(len(list)))
第二步: 随机划分数据集为训练和测试集,并且保存到csv文件中, 默认是583个训练 100个测试
 1 #保存为训练集和测试集合
 2 #输出最后的测试结果
 3
 4 l=[]
 5 csvfile = file(‘F:\\csv_train.csv‘, ‘wb‘)
 6 writer = csv.writer(csvfile)
 7 #n=input(‘你想选几个?‘)
 8 n=583
 9 while n>len(list) or n<=len(list)/2:
10     print ‘数据集选择错误‘
11     n=input(‘请重新输入一个合适的的数:‘)
12
13 print(list[0])
14 while n!=len(l):
15     x=random.randint(0,len(list)-1)
16     if x in l:
17         continue
18     else:
19         print(x)
20         l.append(x)
21         print(list[x])     #tuple不能赋值进行修改
22         writer.writerow(list[x]) #必须是row 没有s
23 csvfile.close()
24 print l
25 csvfiletest = file(‘F:\\csv_test.csv‘, ‘wb‘)
26 writer = csv.writer(csvfiletest)
27 for  i in range(len(list)):
28     if i in l:
29         continue
30     else:
31        writer.writerow(list[i]) #必须是row 没有s
32 csvfile.close()
第三步: 读取训练集开始训练:
 1 # -*- coding:UTF-8 -*-
 2 __author__ = ‘tao‘
 3
 4 import csv
 5 import cv2
 6 import sys
 7 import numpy as np
 8 import math
 9 from sklearn.linear_model import LogisticRegression
10
11 filename = ‘F:/台湾机器学习/data/2/csv_train.csv‘
12 ufilename = unicode(filename , "utf8") #这一块主要是因为汉字路径 也就是python调用open打开文件时,其路径必须要转换为utf-8格式
13 list=[]
14 result=[]
15 row=0
16 colum=0;
17 with open(ufilename, ‘r‘) as f:
18     data = f.readlines()  #dat中所有字符串读入data
19     for line in data:
20         odom = line.split(‘,‘)        #将单个数据分隔开存好
21         colum=len(odom)
22         lists= map(int, odom[0:9])#第三个开始开始数据  一直取9个数
23         results= map(int, odom[9:10])#取第10个数
24         list.append(lists)
25         result.append(results)
26             # print odom
27         row=row+1
28
29 print("原始数据是:{0}行 :{1}列 的数据".format(row, colum))
30 print("有{0}个训练数据".format(len(list)))
31
32
33 #y=w0*x0+w1*x1+w2*x2+w3*x3+w4*x4+w5*x5+w6*x6+w7*x7+w8*x8+b0
34 #z=1/(1+exp(y))
35 #
36 alpha=0.01
37 b_0=np.random.rand(1,1)
38 th = np.random.rand(1,9);
39 print(th)
40 b_0=np.array([[0]])
41
42 th= np.array([[1, 1, 1, 1, 1, 1, 1 ,1, 1]])
43 print(th)
44
45 L =[]
46 batch=100
47 for k in range(2000):
48     length = len(list)
49     jtheta = 0
50     total = 0
51     sum_total = 0
52     count=0
53     error =0
54     for j in range(batch): #batch
55         # print("当前序号{0}训练数据".format(id))
56         xset= np.array(list[j+count*batch]) #一行 X数值
57         yset= np.array(result[j+count*batch]) # 要估计值
58         z=1.0/(1+math.exp((np.dot(th,xset)+b_0)*(-1)))
59         total = total+z- yset
60         error= error +(-1)*(yset*math.log(z,math.e)+(1-yset)*(1-math.log(z,math.e)))
61         # print( "当前误差{0}".format(b_0 +np.dot(th,xset)- yset))
62     b_0 = b_0  - 1.0*alpha/batch*(total)
63     th = th  -  1.0*alpha/batch*(total)*xset
64     L.append(error)
65     count = count +1
66     if(count>=len(list)/batch):
67         break;
68     if(j==batch-1):
69         print " %10.5f  %10.5f %10.5f   %10.5f  %10.5f  %10.5f %10.5f   %10.5f  %10.5f  %10.5f \n" %(b_0,th[0][0],th[0][1],th[0][2],th[0][3],th[0][4],th[0][5],th[0][6],th[0][7],th[0][8])
70
71 #
72 print("-训练得到的权值如下--")
73 print" %10.5f %10.5f  %10.5f %10.5f   %10.5f  %10.5f  %10.5f %10.5f   %10.5f  %10.5f \n" %(b_0,th[0][0],th[0][1],th[0][2],th[0][3],th[0][4],th[0][5],th[0][6],th[0][7],th[0][8])
第四部:测试
#测试训练集
count=0;
for k in range(len(list)):
    xset = np.array(list[k])
    nptresult= np.array(result[k])
     # print(xset)
    # print("预测数据{0}".format( b_0 + th_0 * xset[0]+ th_1 * xset[1]+ th_2 * xset[2]+ th_3 * xset[3]+ th_4 * xset[4]+ th_5 * xset[5]+ th_6 * xset[6]+ th_7 * xset[7]+ th_8 * xset[8]))
    # print("真实数据{0}".format(nptresult))
    z=1.0/(1+math.exp((np.dot(th,xset)+b_0)*(-1)))
    if z>=0.5:
        lgresult=1;
    else:
        lgresult=0;
    if lgresult == nptresult:
        continue
    else:
        count = count+1;
        print("第几个{0}出错".format(k))
print(count)
print("训练数据集的正确率为{0}".format(1-1.0*count/len(list)))


import matplotlib.pyplot as plt

plt.plot(range(len(L)), L, ‘r‘)
plt.xlabel(‘index‘)
plt.ylabel(‘error‘)
plt.title(‘line_regression & gradient decrease‘)
plt.legend()
plt.show()

## 采用模型
# lr = LogisticRegression()
# lr.fit(list,result)
# count=0
# for k in range(len(list)):
#     xset = np.array(list[k])
#     nptresult= np.array(result[k])
#     ly_y_predict= lr.predict(xset)
#     if ly_y_predict == nptresult:
#         continue
#     else:
#         count = count+1;
#         print("第几个{0}出错".format(k))
# print(count)
# print("采用sk模型训练数据集的正确率为{0}".format(1-1.0*count/len(list)))
#
# print ‘accuragy‘,lr.score(list,result)


#读取测试集数据
testfilename = ‘F:/台湾机器学习/data/2/csv_test.csv‘
utestfilename = unicode(testfilename , "utf8") #这一块主要是因为汉字路径 也就是python调用open打开文件时,其路径必须要转换为utf-8格式
testlist=[]
testresult=[]
testrow=0
testcolum=0;

with open(utestfilename, ‘r‘) as f:
    testdata = f.readlines()  #dat中所有字符串读入data
    for line in testdata:
        odom = line.split(‘,‘)        #将单个数据分隔开存好
        testcolum=len(odom)
        testlists= map(int, odom[0:9])#第三个开始开始数据  一直取9个数
        testlist.append(testlists)
        testresults= map(int, odom[9:10])#取第10个数
        testresult.append(testresults)
            # print odom
        testrow=testrow+1

print("测试数据是:{0}行 :{1}列 的数据".format(testrow, testcolum))
print("有{0}个测试数据".format(len(testlist)))


# #我的模型读取测试数据
tcount=0
for k in range(len(testlist)):
    xset = np.array(testlist[k])
    nptresult= np.array(testresult[k])
    z= 1.0/(1+math.exp((np.dot(th,xset)+b_0)*(-1)))
    lgresult=0
    if z>=0.5:
        lgresult=1;
    else:
        lgresult=0;
    if lgresult == nptresult:
        continue
    else:
        tcount = tcount+1;
        print("第几个{0}出错".format(k))
print(tcount)
print("测试数据集的正确率为{0}".format(1-1.0*tcount/len(testlist)))


# #模型读取测试数据
# tcount=0
# for k in range(len(testlist)):
#     xset = np.array(testlist[k])
#     nptresult= np.array(testresult[k])
#     ly_y_predict= lr.predict(xset)
#     if ly_y_predict == nptresult:
#         continue
#     else:
#         tcount = tcount+1;
#         print("第几个{0}出错".format(k))
# print(tcount)
# print("采用sk测试数据集的正确率为{0}".format(1-1.0*tcount/len(testlist)))
损失函数下降图像:
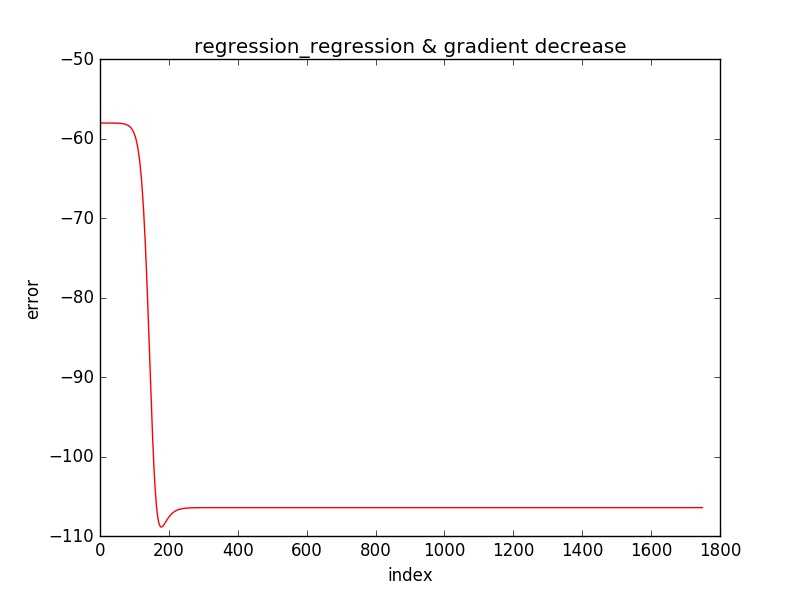
测试数据集正确率:86%左右 。
可是用sklearn自己带的模型是 96%
囧。。。。想想办法刷刷数据,这个程序设计到 从读取CSV文件中随机的划分训练集和测试集合。通过计算出损失函数利用matplot绘图
标签:估计 nis learn adl 绘图 amp author logs machine
原文地址:http://www.cnblogs.com/stevendes1/p/6725885.html