标签:汇总 shape tput hidden 分布图 tmp 过程 实例 ati
PPT设计原则中有这样一条,叫“文不如表,表不如图”,可见图表在表达中更为直观、明确。程序设计中也是一样,我们经常用图表来描述程序的结构和流程,本文所述的Tensorboard就是Tensorflow提供的一款强大的可视化工具,可以借助图表更方便地进行Tensorflow程序的理解、调试和优化。
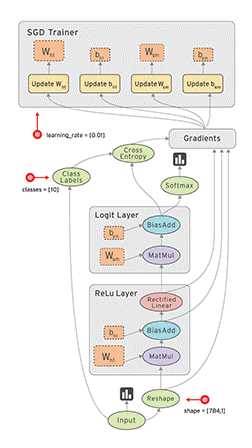
左面的数据流图cool吗?它是Tensorflow官网上给出的demo,下面,本文就结合一个具体的例子,介绍下Tensorboard的基本使用。
Tensorboard的使用可大体归结为如下几步:
1) 在构建graph的过程中,记录你想要追踪的Tensor
2) Session会话运行上一步骤中的记录
3) 查看可视化效果
那么如何具体操作呢?先走一波示例代码,一个用三层神经网络实现回归问题的小例子
 1 import tensorflow as tf
 2 import numpy as np
 3 import matplotlib.pyplot as plt
 4
 5 def add_layer(inputs, in_size, out_size, n_layer, activation_function = None):
 6     # add one more layer and return the output of this layer
 7     layer_name = ‘layer%s‘ % n_layer
 8     with tf.name_scope(‘layer‘):
 9         with tf.name_scope(‘weights‘):
10             Weights = tf.Variable(tf.random_normal([in_size, out_size]), name = ‘W‘)
11             tf.summary.histogram(layer_name + ‘/weights‘, Weights)
12         with tf.name_scope(‘biases‘):
13             biases = tf.Variable(tf.zeros([1,out_size]) + 0.1, name = ‘b‘)
14             tf.summary.histogram(layer_name + ‘/biases‘, biases)
15         with tf.name_scope(‘Wx_plus_b‘):
16             Wx_plus_b = tf.add(tf.matmul(inputs, Weights), biases, name = ‘Wpb‘)
17         if activation_function is None:
18             outputs = Wx_plus_b
19         else:
20             outputs = activation_function(Wx_plus_b)
21         tf.summary.histogram(layer_name + ‘/outputs‘, outputs)
22         return outputs
23
24 #define placeholder for inputs
25 with tf.name_scope(‘inputs‘):
26     xs = tf.placeholder(tf.float32, [None, 1], name = ‘x_input‘)
27     ys = tf.placeholder(tf.float32, [None, 1], name = ‘y_input‘)
28
29 # make up some real data
30 x_data = np.linspace(-1.0, 1.0, 300, dtype = np.float32)[:,np.newaxis]
31 noise = np.random.normal(0.0, 0.05, x_data.shape)
32 y_data = np.square(x_data) + 0.5 + noise
33
34 # add hidden layer and output layer
35 l1 = add_layer(xs, 1, 10, n_layer = 1, activation_function = tf.nn.relu)
36 prediction = add_layer(l1, 10, 1, n_layer = 2, activation_function = None)
37
38 # the error between prediction and real data
39 with tf.name_scope(‘loss‘):
40     loss = tf.reduce_mean(tf.reduce_sum(tf.square(ys - prediction), reduction_indices = [1]), name = ‘L‘)
41     tf.summary.scalar(‘loss‘, loss)
42 with tf.name_scope(‘train‘):
43     train_step = tf.train.GradientDescentOptimizer(0.1).minimize(loss)
44
45 init = tf.initialize_all_variables()
46 with tf.Session() as sess:
47     sess.run(init)
48     fig = plt.figure()
49     ax = fig.add_subplot(1,1,1)
50     ax.scatter(x_data, y_data)
51     plt.show(block = False)
52     merged =tf.summary.merge_all()
53     writer = tf.summary.FileWriter(‘/tmp/tensorlogs/ex5‘, sess.graph)
54     for i in range(1000):
55         sess.run(train_step, feed_dict = {xs : x_data, ys : y_data})
56         if i % 50 == 0:
57             # print(i, sess.run(loss, feed_dict = {xs : x_data, ys : y_data}))
58             try:
59                 ax.lines.remove(lines[0])
60             except Exception:
61                 pass
62             result, prediction_value = sess.run([merged, prediction], feed_dict = {xs : x_data, ys : y_data})
63             lines = ax.plot(x_data, prediction_value, ‘r-‘, lw = 5)
64             plt.pause(0.1)
65             writer.add_summary(result, i)
下面具体分解上述的3个步骤
1) 在上述示例中用了tf.summary.histogram()和tf.summary.scalar()记录要追踪的Tensor,前者可汇总和记录标量数据,如41行的loss;后者可汇总和记录变量为直方图,如11行的Weights。此外,tf.summary还可汇总记录图片(images),音频(Audio)等内容。
2) 在Session中运行之前,要将上述所有汇总记录做一个合并,以便统一运行,如52行的merged所示,还要指定运行后存放数据记录的日志文件的位置,如53行的writer所示。接下来,就可以通过运行获取数据记录了,如62行的result所示,这里为了简洁,将result和prediction_value放在了一起运行,也可以拆成两行执行。程序要进行多次训练,如54行的for所示,每隔50次记录下追踪数据,如56行if所示,每次记录通过writer.add_summary()添加到日志文件中。
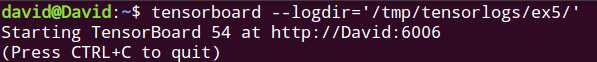
3) 程序运行结束后,打开终端,输入tensorboard --logdir=‘path‘,其中的path为指定的日志文件存放路径,如53行‘/tmp/tensorlogs/ex5‘,运行后会看到下图所示
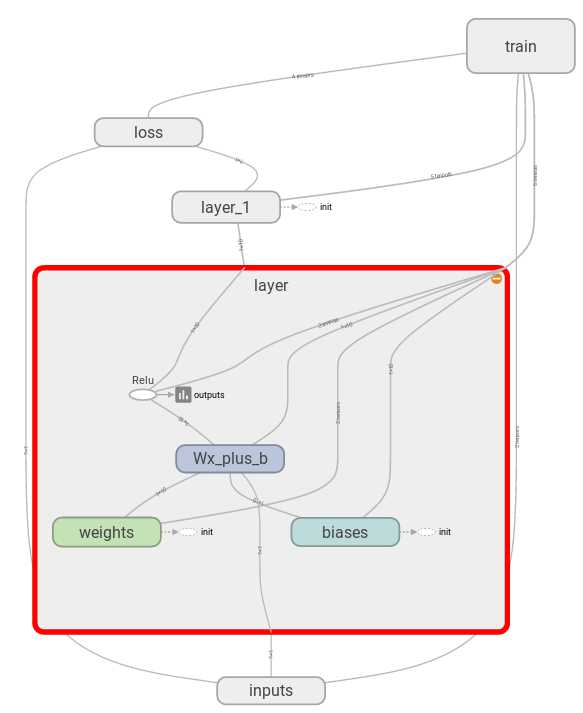
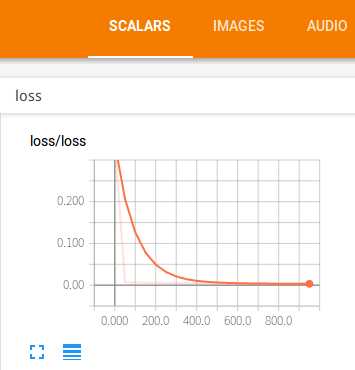
在浏览器的地址栏中输入上图中所示的地址http://David:6006,就会看到如下图所示的tensorboard图表:
graph: 程序图的结构
scalars: 损失函数的值随着训练次数的增加逐步下降
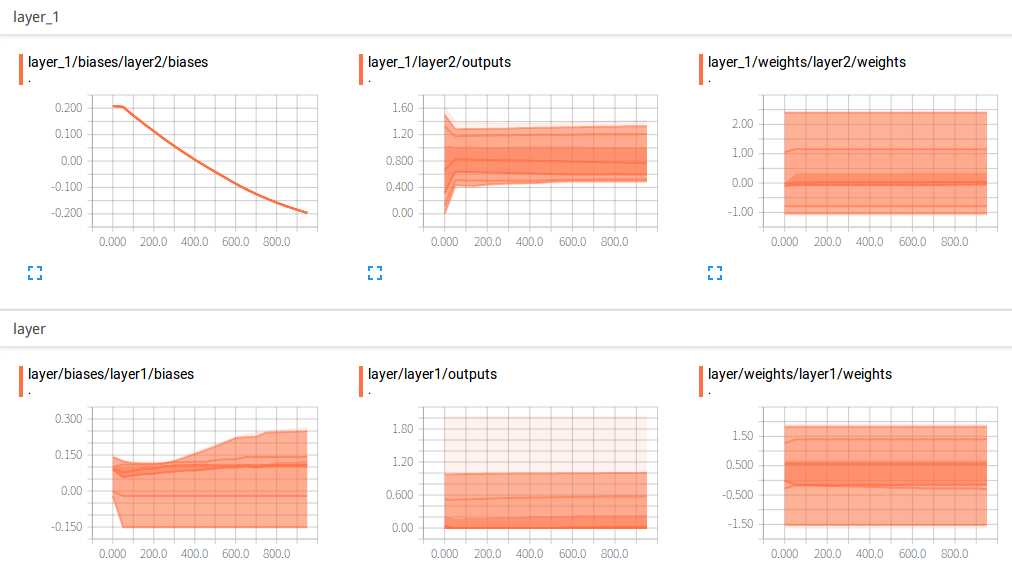
distributions: 隐藏层和输出层参数的分布图
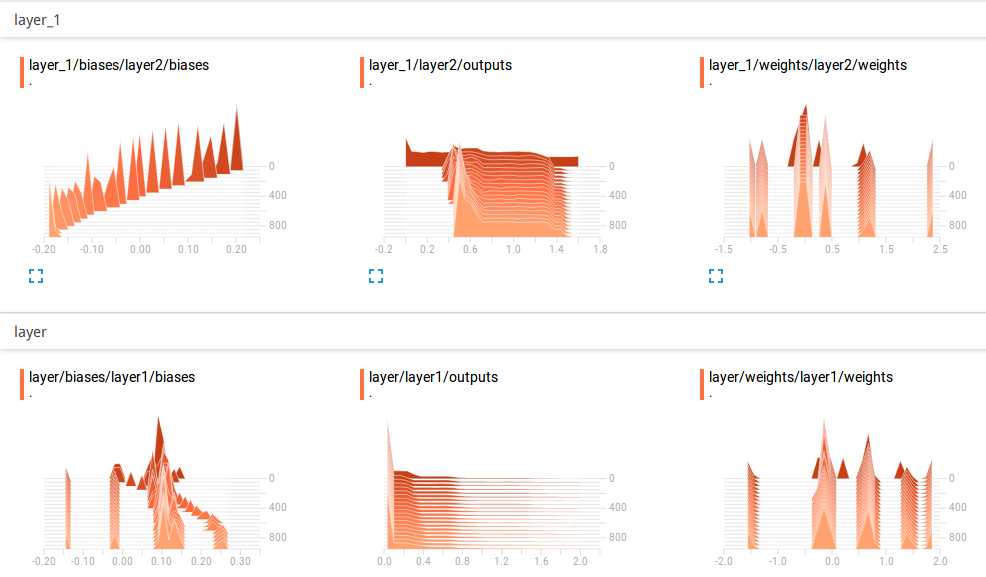
histograms: 隐藏层和输出层参数的直方图
tensorboard的使用对于程序的理解、分析和优化都很有帮助,本文结合一个小的程序例子介绍了tensorboard的基本使用,更多内容可参看官方文档中关于Mnist数据集的代码实例。本文的实验环境为ubuntu16.04+tensorflow1.1。
标签:汇总 shape tput hidden 分布图 tmp 过程 实例 ati
原文地址:http://www.cnblogs.com/David-Wei/p/6984898.html