标签:att ima tle code otl 迭代器 port pac nts
from matplotlib import pyplot as plt
import matplotlib.animation as animation
import numpy as np


def update_point(num):
    fig_points.set_data(data[:, 0:num])
    return fig_points,

fig1 = plt.figure()

num_point = 50
data = np.random.rand(2, num_point)
fig_points, = plt.plot([], [], ‘ro‘)

plt.xlim(0, 1)
plt.ylim(0, 1)
plt.xlabel(‘x‘)
plt.title(‘Scatter Point‘)

# interval
# repeat
# frames
# fargs
# init_func
anim = animation.FuncAnimation(fig1, update_point,num_point)

#anim = animation.FuncAnimation(fig1, update_point,frames=num_point, interval=50, blit=False, repeat=False)

plt.show()
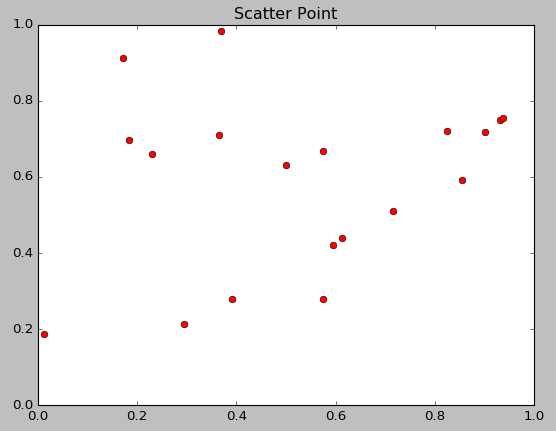
这种方式每经过interval的时间后会调用函数(传入当前帧号)绘制一幅新图更新原图:
Init()是我们的动画在在创建动画基础框架(base frame)时调用的函数。这里我们们用一个非常简单的对line什么都不做的函数。这个函数一定要返回line对象,这个很重要,因为这样就能告诉动画之后要更新的内容,也就是动作的内容是line。--来自( http://mytrix.me/2013/08/matplotlib-animation-tutorial/ )
在这个动画函数中修改你的图
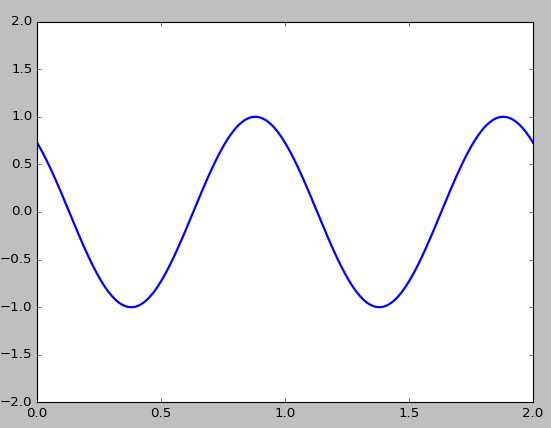
绘制正弦波函数:
可以使用多个线对象来同时更新多个子图于同一个动画生成器之中,不过这需要上面1~3步同时支持(就是写出来)多个线对象
import numpy as np
from matplotlib import pyplot as plt
from matplotlib import animation

# 1.First set up the figure, the axis, and the plot element we want to animate
fig = plt.figure()
ax = plt.axes(xlim=(0,2),ylim=(-2,2))
line, = ax.plot([],[],lw=2)


# 2.initialization function: plot the background of each frame
def init():
    line.set_data([],[])
    return line,


# 3.animation function.  This is called sequentially
# note: i is framenumber
def update(i):
    x = np.linspace(0,2,1000)
    y = np.sin(2 * np.pi * (x - 0.01 * i))  # 调整x相当于向右平移图像
    line.set_data(x,y)
    return line,


# call the animator.  blit=True means only re-draw the parts that have changed.
# 画布, 使用帧数做参数的绘制函数, init生成器.。
anim = animation.FuncAnimation(fig,update,init_func=init,frames=200,interval=20,blit=False)
# frames=200   帧数
# interval=20  间隔

# anim.save(‘anim3.mp4‘, fps=30, extra_args=[‘-vcodec‘, ‘libx264‘])      # 保存为mp4
# anim.save(‘anim3.gif‘, writer=‘imagemagick‘)                           # 保存为gif

plt.show()
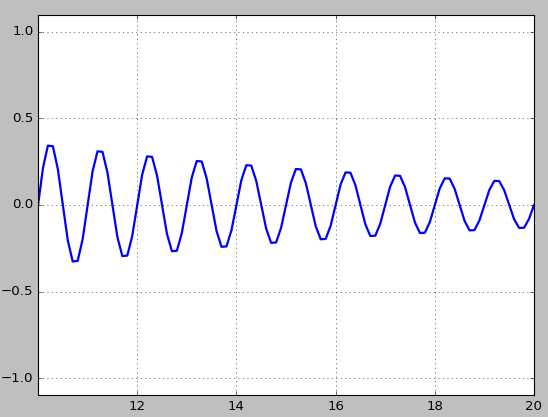
绘制衰减波
import numpy as np
import matplotlib.pyplot as plt
import matplotlib.animation as animation


def data_gen():
    t = 0
    cnt = 0
    while cnt < 200:
        cnt += 1
        t += 0.1
        yield t,np.sin(2 * np.pi * t) * np.exp(-t / 10.)


def init():
    ax.set_ylim(-1.1,1.1)
    ax.set_xlim(0,10)
    line.set_data([],[])
    return line,


def update(datag):
    # update the data
    t,y = datag
    xdata.append(t)
    ydata.append(y)
    line.set_data(xdata,ydata)

    if max(xdata) > 10:
        ax.set_xlim(max(xdata) - 10,max(xdata))
    return line,


fig,ax = plt.subplots()
line, = ax.plot([],[],lw=2)
ax.grid()
xdata,ydata = [],[]

ani = animation.FuncAnimation(fig,update,data_gen,interval=10,repeat=False,init_func=init)
plt.show()
『python』科学计算专项_科学绘图库matplotlib学习之绘制动画(待续)
标签:att ima tle code otl 迭代器 port pac nts
原文地址:http://www.cnblogs.com/hellcat/p/7086850.html