标签:format pat type path atp end blog ipython 技术分享
1、启动: ipython --pylab
C:\Users\****>ipython --pylab
Python 3.6.1 (v3.6.1:69c0db5, Mar 21 2017, 18:41:36) [MSC v.1900 64 bit (AMD64)]
Type ‘copyright‘, ‘credits‘ or ‘license‘ for more information
IPython 6.1.0 -- An enhanced Interactive Python. Type ‘?‘ for help.
Using matplotlib backend: TkAgg

In [1]: plot(np.arange(10)) #测试matplotlib是否正常工作
Out[1]: [<matplotlib.lines.Line2D at 0x2353b9389b0>]#并弹出曲线图
2、通常引入的约定是: import matplotlib.pyplot as plot
3、matplotlib的图像都位于Figure对象中,subplot是绘制在Figure上的子图表。
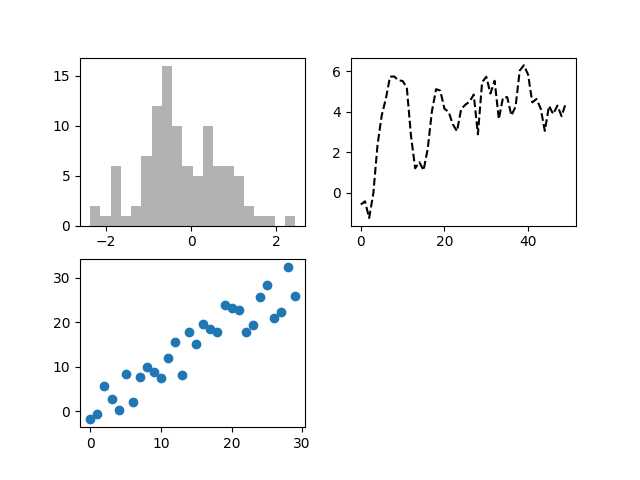
In [1]: import matplotlib.pyplot as plot

In [2]: fig=plt.figure() #创建一个Figure对象

In [3]: ax1=fig.add_subplot(2,2,1) #在Figure中创建一个名为ax1的subplot 共2*2=4个,ax1是第一个

In [4]: ax2=fig.add_subplot(2,2,2) #在Figure中创建一个名为ax2的subplot 共2*2=4个,ax2是第二个

In [5]: from numpy.random import randn # 引入numpy中的random

In [6]: plt.plot(randn(50).cumsum(),‘k--‘) # 随机50个数字,k--代表线型
Out[6]: [<matplotlib.lines.Line2D at 0x2891e627908>]

In [7]: _=ax1.hist(randn(100),bins=20,color=‘k‘,alpha=0.3) # 直方图

In [8]: ax3=fig.add_subplot(2,2,3)

In [9]: ax3.scatter(np.arange(30),np.arange(30)+3*randn(30)) # 散点图
Out[9]: <matplotlib.collections.PathCollection at 0x2891e7fd860>
 、
、
标签:format pat type path atp end blog ipython 技术分享
原文地址:http://www.cnblogs.com/matplot/p/7087809.html