标签:style http color os io 使用 ar strong for
安装很简单,如下:

安装完后就可以使用了,dstat非常强大,可以实时的监控cpu、磁盘、网络、IO、内存等使用情况。
直接使用dstat,默认使用的是-cdngy参数,分别显示cpu、disk、net、page、system信息,默认是1s显示一条信息。可以在最后指定显示一条信息的时间间隔,如dstat 5是没5s显示一条,dstat 5 10表示没5s显示一条,一共显示10条。
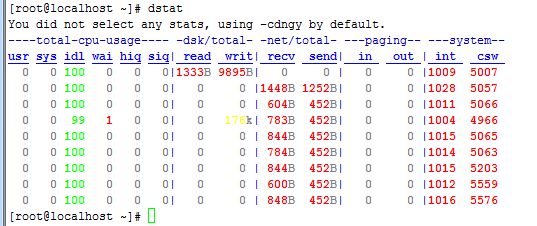
下面对显示出来的部分信息作一些说明:
1. cpu:hiq,siq分别为硬中断和软中断次数。
2. system:int,csw分别为系统的中断次数(interrupt)和上下文切换(context switch)
其他的都很好理解。
通过dstat --help可以看到常用参数选项
[root@localhost ~]# dstat --help
Usage: dstat [-afv] [options..] [delay [count]]
Versatile tool for generating system resource statistics
Dstat options:
-c, --cpu enable cpu stats
-C 0,3,total include cpu0, cpu3 and total
-d, --disk enable disk stats
-D total,hda include hda and total
-g, --page enable page stats
-i, --int enable interrupt stats
-I 5,eth2 include int5 and interrupt used by eth2
-l, --load enable load stats
-m, --mem enable memory stats
-n, --net enable network stats
-N eth1,total include eth1 and total
-p, --proc enable process stats
-r, --io enable io stats (I/O requests completed)
-s, --swap enable swap stats
-S swap1,total include swap1 and total
-t, --time enable time/date output
-T, --epoch enable time counter (seconds since epoch)
-y, --sys enable system stats
--aio enable aio stats
--fs, --filesystem enable fs stats
--ipc enable ipc stats
--lock enable lock stats
--raw enable raw stats
--socket enable socket stats
--tcp enable tcp stats
--udp enable udp stats
--unix enable unix stats
--vm enable vm stats
--plugin-name enable plugins by plugin name (see manual)
--list list all available plugins
-a, --all equals -cdngy (default)
-f, --full automatically expand -C, -D, -I, -N and -S lists
-v, --vmstat equals -pmgdsc -D total
--float force float values on screen
--integer force integer values on screen
--bw, --blackonwhite change colors for white background terminal
--nocolor disable colors (implies --noupdate)
--noheaders disable repetitive headers
--noupdate disable intermediate updates
--output file write CSV output to file
delay is the delay in seconds between each update (default: 1)
count is the number of updates to display before exiting (default: unlimited)
[root@localhost ~]#
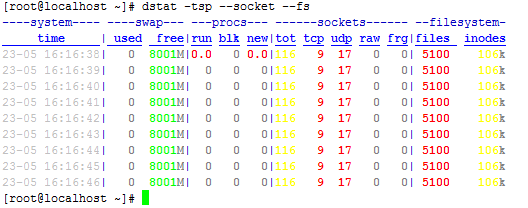
如想监控swap,process,sockets,filesystem并显示监控的时间
若要将结果输出到文件可以加--output filename

这样生成的csv文件可以用excel打开,然后生成图表。
通过dstat --list可以查看dstat能使用的所有参数,其中上面internal是dstat本身自带的一些监控参数,下面/usr/share/dstat中是dstat的插件,这些插件可以扩展dstat的功能,如可以监控电源(battery)、mysql等。
下面这些插件并不是都可以直接使用的,有的还依赖其他包,如想监控mysql,必须要装python连接mysql的一些包。

如我们可以看下当前最消耗IO的进程和最消耗块设备IO的进程可以执行如下命令:

这里使用了dstat的插件,更多功能有待进一步挖掘。
标签:style http color os io 使用 ar strong for
原文地址:http://my.oschina.net/syyzhan/blog/311218
