标签:each cal lambda new 9.png class ima otl 博客
数据集如下:
 1 色泽    根蒂    敲声    纹理    脐部    触感    好瓜
 2 青绿    蜷缩    浊响    清晰    凹陷    硬滑    是
 3 乌黑    蜷缩    沉闷    清晰    凹陷    硬滑    是
 4 乌黑    蜷缩    浊响    清晰    凹陷    硬滑    是
 5 青绿    蜷缩    沉闷    清晰    凹陷    硬滑    是
 6 浅白    蜷缩    浊响    清晰    凹陷    硬滑    是
 7 青绿    稍蜷    浊响    清晰    稍凹    软粘    是
 8 乌黑    稍蜷    浊响    稍糊    稍凹    软粘    是
 9 乌黑    稍蜷    浊响    清晰    稍凹    硬滑    是
10 乌黑    稍蜷    沉闷    稍糊    稍凹    硬滑    否
11 青绿    硬挺    清脆    清晰    平坦    软粘    否
12 浅白    硬挺    清脆    模糊    平坦    硬滑    否
13 浅白    蜷缩    浊响    模糊    平坦    软粘    否
14 青绿    稍蜷    浊响    稍糊    凹陷    硬滑    否
15 浅白    稍蜷    沉闷    稍糊    凹陷    硬滑    否
16 乌黑    稍蜷    浊响    清晰    稍凹    软粘    否
17 浅白    蜷缩    浊响    模糊    平坦    硬滑    否
18 青绿    蜷缩    沉闷    稍糊    稍凹    硬滑    否
基于信息增益的ID3决策树的原理这里不再赘述,读者如果不明白可参考西瓜书对这部分内容的讲解。
python实现代码如下:
  1 from math import log2
  2 import pandas as pd
  3 import matplotlib.pyplot as plt
  4 from matplotlib.font_manager import FontProperties
  5
  6 # 统计label出现次数
  7 def get_counts(data):
  8     total = len(data)
  9     results = {}
 10     for d in data:
 11         results[d[-1]] = results.get(d[-1], 0) + 1
 12     return results, total
 13
 14 # 计算信息熵
 15 def calcu_entropy(data):
 16     results, total = get_counts(data)
 17     ent = sum([-1.0*v/total*log2(v/total) for v in results.values()])
 18     return ent
 19
 20 # 计算每个feature的信息增益
 21 def calcu_each_gain(column, update_data):
 22     total = len(column)
 23     grouped = update_data.iloc[:, -1].groupby(by=column)
 24     temp = sum([len(g[1])/total*calcu_entropy(g[1]) for g in list(grouped)])
 25     return calcu_entropy(update_data.iloc[:, -1]) - temp
 26
 27 # 获取最大的信息增益的feature
 28 def get_max_gain(temp_data):
 29     columns_entropy = [(col, calcu_each_gain(temp_data[col], temp_data)) for col in temp_data.iloc[:, :-1]]
 30     columns_entropy = sorted(columns_entropy, key=lambda f: f[1], reverse=True)
 31     return columns_entropy[0]
 32
 33 # 去掉数据中已存在的列属性内容
 34 def drop_exist_feature(data, best_feature):
 35     attr = pd.unique(data[best_feature])
 36     new_data = [(nd, data[data[best_feature] == nd]) for nd in attr]
 37     new_data = [(n[0], n[1].drop([best_feature], axis=1)) for n in new_data]
 38     return new_data
 39
 40 # 获得出现最多的label
 41 def get_most_label(label_list):
 42     label_dict = {}
 43     for l in label_list:
 44         label_dict[l] = label_dict.get(l, 0) + 1
 45     sorted_label = sorted(label_dict.items(), key=lambda ll: ll[1], reverse=True)
 46     return sorted_label[0][0]
 47
 48 # 创建决策树
 49 def create_tree(data_set, column_count):
 50     label_list = data_set.iloc[:, -1]
 51     if len(pd.unique(label_list)) == 1:
 52         return label_list.values[0]
 53     if all([len(pd.unique(data_set[i])) ==1 for i in data_set.iloc[:, :-1].columns]):
 54         return get_most_label(label_list)
 55     best_attr = get_max_gain(data_set)[0]
 56     tree = {best_attr: {}}
 57     exist_attr = pd.unique(data_set[best_attr])
 58     if len(exist_attr) != len(column_count[best_attr]):
 59         no_exist_attr = set(column_count[best_attr]) - set(exist_attr)
 60         for nea in no_exist_attr:
 61             tree[best_attr][nea] = get_most_label(label_list)
 62     for item in drop_exist_feature(data_set, best_attr):
 63         tree[best_attr][item[0]] = create_tree(item[1], column_count)
 64     return tree
 65
 66 # 决策树绘制这部分基本参考《机器学习实战》书内的代码以及博客 => http://blog.csdn.net/c406495762/article/details/76262487
 67 # 获取树的叶子节点数目
 68 def get_num_leafs(decision_tree):
 69     num_leafs = 0
 70     first_str = next(iter(decision_tree))
 71     second_dict = decision_tree[first_str]
 72     for k in second_dict.keys():
 73         if isinstance(second_dict[k], dict):
 74             num_leafs += get_num_leafs(second_dict[k])
 75         else:
 76             num_leafs += 1
 77     return num_leafs
 78
 79 # 获取树的深度
 80 def get_tree_depth(decision_tree):
 81     max_depth = 0
 82     first_str = next(iter(decision_tree))
 83     second_dict = decision_tree[first_str]
 84     for k in second_dict.keys():
 85         if isinstance(second_dict[k], dict):
 86             this_depth = 1 + get_tree_depth(second_dict[k])
 87         else:
 88             this_depth = 1
 89         if this_depth > max_depth:
 90             max_depth = this_depth
 91     return max_depth
 92
 93 # 绘制节点
 94 def plot_node(node_txt, center_pt, parent_pt, node_type):
 95     arrow_args = dict(arrowstyle=‘<-‘)
 96     font = FontProperties(fname=r‘C:\Windows\Fonts\STXINGKA.TTF‘, size=15)
 97     create_plot.ax1.annotate(node_txt, xy=parent_pt,  xycoords=‘axes fraction‘, xytext=center_pt,
 98                             textcoords=‘axes fraction‘, va="center", ha="center", bbox=node_type,
 99                             arrowprops=arrow_args, FontProperties=font)
100
101 # 标注划分属性
102 def plot_mid_text(cntr_pt, parent_pt, txt_str):
103     font = FontProperties(fname=r‘C:\Windows\Fonts\MSYH.TTC‘, size=10)
104     x_mid = (parent_pt[0] - cntr_pt[0]) / 2.0 + cntr_pt[0]
105     y_mid = (parent_pt[1] - cntr_pt[1]) / 2.0 + cntr_pt[1]
106     create_plot.ax1.text(x_mid, y_mid, txt_str, va="center", ha="center", color=‘red‘, FontProperties=font)
107
108 # 绘制决策树
109 def plot_tree(decision_tree, parent_pt, node_txt):
110     d_node = dict(boxstyle="sawtooth", fc="0.8")
111     leaf_node = dict(boxstyle="round4", fc=‘0.8‘)
112     num_leafs = get_num_leafs(decision_tree)
113     depth = get_tree_depth(decision_tree)
114     first_str = next(iter(decision_tree))
115     cntr_pt = (plot_tree.xoff + (1.0 +float(num_leafs))/2.0/plot_tree.totalW, plot_tree.yoff)
116     plot_mid_text(cntr_pt, parent_pt, node_txt)
117     plot_node(first_str, cntr_pt, parent_pt, d_node)
118     second_dict = decision_tree[first_str]
119     plot_tree.yoff = plot_tree.yoff - 1.0/plot_tree.totalD
120     for k in second_dict.keys():
121         if isinstance(second_dict[k], dict):
122             plot_tree(second_dict[k], cntr_pt, k)
123         else:
124             plot_tree.xoff = plot_tree.xoff + 1.0/plot_tree.totalW
125             plot_node(second_dict[k], (plot_tree.xoff, plot_tree.yoff), cntr_pt, leaf_node)
126             plot_mid_text((plot_tree.xoff, plot_tree.yoff), cntr_pt, k)
127     plot_tree.yoff = plot_tree.yoff + 1.0/plot_tree.totalD
128
129 def create_plot(dtree):
130     fig = plt.figure(1, facecolor=‘white‘)
131     fig.clf()
132     axprops = dict(xticks=[], yticks=[])
133     create_plot.ax1 = plt.subplot(111, frameon=False, **axprops)
134     plot_tree.totalW = float(get_num_leafs(dtree))
135     plot_tree.totalD = float(get_tree_depth(dtree))
136     plot_tree.xoff = -0.5/plot_tree.totalW
137     plot_tree.yoff = 1.0
138     plot_tree(dtree, (0.5, 1.0), ‘‘)
139     plt.show()
140
141 if __name__ == ‘__main__‘:
142     my_data = pd.read_csv(‘./watermelon2.0.csv‘, encoding=‘gbk‘)
143     column_count = dict([(ds, list(pd.unique(my_data[ds]))) for ds in my_data.iloc[:, :-1].columns])
144     d_tree = create_tree(my_data, column_count)
145     create_plot(d_tree)
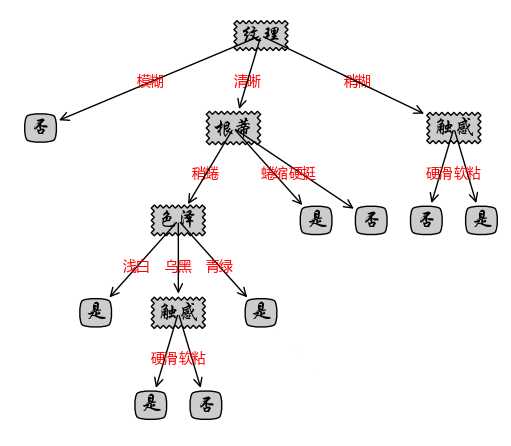
绘制的决策树如下:
基于周志华西瓜书数据的简单决策树(信息增益)的python代码实现
标签:each cal lambda new 9.png class ima otl 博客
原文地址:http://www.cnblogs.com/laresh/p/7676170.html