标签:nes ado 模块 line map shadow ima src lines
1.下载依赖
cnpm i echarts -S
2.模块中引入
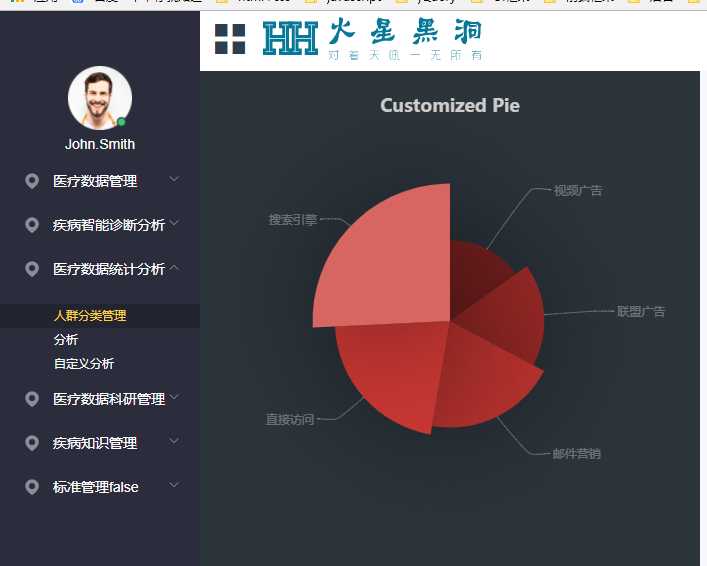
<template>
  <div class="analyzeSystem">
    <div :class="className" :id="id" :style="{height:height,width:width}" ref="myEchart"></div>
  </div>
</template>

<script>
import echarts from "echarts";
export default {
  name: "analyzeSystem",
  props: {
    className: {
      type: String,
      default: "yourClassName"
    },
    id: {
      type: String,
      default: "yourID"
    },
    width: {
      type: String,
      default: "500px"
    },
    height: {
      type: String,
      default: "500px"
    }
  },
  data() {
    return {
      chart: null
    };
  },
  mounted() {
    this.initChart();
  },
  beforeDestroy() {
    if (!this.chart) {
      return;
    }
    this.chart.dispose();
    this.chart = null;
  },
  methods: {
    initChart() {
      this.chart = echarts.init(this.$refs.myEchart);
      // 把配置和数据放这里
      this.chart.setOption({
        backgroundColor: "#2c343c",

        title: {
          text: "Customized Pie",
          left: "center",
          top: 20,
          textStyle: {
            color: "#ccc"
          }
        },

        tooltip: {
          trigger: "item",
          formatter: "{a} <br/>{b} : {c} ({d}%)"
        },

        visualMap: {
          show: false,
          min: 80,
          max: 600,
          inRange: {
            colorLightness: [0, 1]
          }
        },
        series: [
          {
            name: "访问来源",
            type: "pie",
            radius: "55%",
            center: ["50%", "50%"],
            data: [
              { value: 335, name: "直接访问" },
              { value: 310, name: "邮件营销" },
              { value: 274, name: "联盟广告" },
              { value: 235, name: "视频广告" },
              { value: 400, name: "搜索引擎" }
            ].sort(function(a, b) {
              return a.value - b.value;
            }),
            roseType: "radius",
            label: {
              normal: {
                textStyle: {
                  color: "rgba(255, 255, 255, 0.3)"
                }
              }
            },
            labelLine: {
              normal: {
                lineStyle: {
                  color: "rgba(255, 255, 255, 0.3)"
                },
                smooth: 0.2,
                length: 10,
                length2: 20
              }
            },
            itemStyle: {
              normal: {
                color: "#c23531",
                shadowBlur: 200,
                shadowColor: "rgba(0, 0, 0, 0.5)"
              }
            },

            animationType: "scale",
            animationEasing: "elasticOut",
            animationDelay: function(idx) {
              return Math.random() * 200;
            }
          }
        ]
      });
    }
  }
};
</script>

<style>

</style>
3.效果展示
4.如果配置里的数据是请求来的
    initChart() {
      this.chart = echarts.init(this.$refs.myEchart);
      // 把配置和数据放这里
      this.axios.get(‘/url‘).then((data) => {
        this.chart.setOption({

        })
      })
    }
标签:nes ado 模块 line map shadow ima src lines
原文地址:http://www.cnblogs.com/ldlx-mars/p/7815328.html